📌 As of 3 July 2026 — a point-in-time view. Financials corrected 30 August 2026. For our current, filings-based work on Korean memory, see our SK hynix reference article.
✏️ Correction — 30 August 2026. The FY2024 and FY2025 net-income figures in the table below were wrong. We printed ₩25.4T (2024) and ₩33.8T (2025). Samsung Electronics’ audited consolidated accounts report net profit — 당기순이익 — of ₩34.451T and ₩45.207T, of which ₩33.621T and ₩44.261T is attributable to owners of the parent. The forward P/E printed as 10.5× is also wrong: on 5,919,637,922 issued common shares at the ₩309,500 price used here (a KRX settled close, not a filing figure) and this report’s own ₩120T estimate for 2026, the multiple is 15.3× (that share count was itself stale — see the further correction below; the figure is 15.08×). That change removes the “significant discount to Micron” claim, and the valuation section has been rewritten accordingly. We have also added the FY2025 actual ROE of 10.4%; the 24.2% quoted below was a forward estimate and was never labelled as one. Revenue and operating profit were checked against the same filing and were correct — they are unchanged. Source: DART, FY2025 annual report, rcpNo 20260310002820, filed 10 March 2026. See our corrections policy.
✏️ Further corrected — 30 August 2026 (second pass). The share counts used in the correction above were stale, in both classes. We computed market value on 5,919,637,922 common and 815,974,664 preferred shares, the issued totals at 31 December 2025. Samsung cancelled shares in both classes during the first half of 2026. The share-total schedule of the FY2025 annual report (rcpNo 20260310002820) shows 5,919,637,922 common and 815,974,664 preferred issued, with 13,603,461 of the preferred held in treasury. The same schedule in the half-year report (rcpNo 20260814003699) shows 5,846,278,608 common (−73,359,314) and 802,371,203 preferred (−13,603,461), and no treasury preferred at all — Samsung retired that entire holding.
Those were the counts in force on 3 July 2026, the price date used throughout, and the Korea Exchange listed exactly those totals that day. The multiples have been recomputed: common market value ₩1,832T ($1.19tn) → ₩1,809.42T ($1.173tn), forward P/E 15.3× → 15.08×, and the both-classes-at-the-common-price figure 17.4× → 17.15×. We have also added the multiple struck at the preferred’s own 3 July settled close of ₩208,000, which gives 16.47× and pins down the range the note below could previously only bracket. The conclusion does not change, and is slightly strengthened: 15.08× is still level with the 15.2× this report lists for Micron, and on the all-share-class figure Samsung was dearer than Micron, not cheaper. Prices and listed share counts in this paragraph are KRX settled data for 3 July 2026, not filing figures.
- 💰 FY2025 on the record: revenue ₩333.61T, operating profit ₩43.60T (13.1% margin), net profit ₩45.21T, basic EPS ₩6,605. (Source: DART rcpNo 20260310002820)
- ⚖️ The discount was an arithmetic error: at ₩309,500 the forward multiple on this report’s own ₩120T 2026 estimate is 15.08× — essentially level with the 15.2× it lists for Micron, not the 10.5× originally printed. Count every share class at its own close and it is 16.47×, above Micron.
- 📉 Reported ROE was 10.4% in FY2025, not the 24.2% the valuation section leaned on — that was a forward estimate presented as though it were an actual.
💵 Price at writing (3 July 2026, KRX settled close): $201 (₩309,500)
🎯 Target discussed (3 July 2026): $266 (₩410,000)
📈 Implied upside at the time: 32.4%
Both figures are the point-in-time record of what this report said on 3 July 2026. Neither is a current view, and we do not publish target prices. FX ₩1,542/$ (USD/KRW, 2 Jul 2026, FinanceDataReader).
*Market Report as at 3 July 2026*
Samsung Electronics Valuation: Memory Supercycle and HBM Supply Chain Integration
Samsung Electronics (KRX: 005930), the crown jewel of South Korea’s technology sector and the world’s largest memory chip manufacturer, is entering one of the most profitable phases in its history. After weathering a severe semiconductor downturn in 2023 and early 2024, the company is reaping the rewards of an aggressive capital investment strategy. The ongoing AI infrastructure boom has triggered a massive demand spike for high-value memory architectures, driving a powerful recovery.
This report provides a comprehensive valuation of Samsung Electronics, focusing on the 2026 memory supercycle, the expansion of High Bandwidth Memory (HBM) production capacity, foundry business developments, and a comparison against global semiconductor peers. Samsung is one of the two anchors of Korea’s broader chip supercycle — the structural, AI-driven memory boom now steering the KOSPI.
📈 Financial Trajectory and Memory Supercycle Dynamics
Samsung Electronics’ financial recovery is accelerating. While the company’s operating profit dipped during the memory price collapse of 2023, the subsequent recovery in 2024 and the further step up in 2025 have paved the way for a much larger fiscal year 2026 on the estimates used here.
Three-Year Financial Trajectory
The following table sets out the recovery and scale expansion of Samsung Electronics. The 2024 and 2025 columns are the audited consolidated figures as filed with DART; the 2026 column is an estimate published with this report on 3 July 2026, reflecting rising Average Selling Prices (ASPs) of DRAM and NAND flash.
| Financial Metric | 2024 | 2025 | 2026 (Est.) | Operating Margin Trend (Visual) |
|---|---|---|---|---|
| Revenue (KRW Trillion) | ₩300.9T | ₩333.6T | ₩445.0T | 10.9% |
| Operating Profit (KRW Trillion) | ₩32.7T | ₩43.6T | ₩155.0T | 13.1% |
| Net Profit — 당기순이익 (KRW Trillion) | ₩34.45T owners’ share: ₩33.62T |
₩45.21T owners’ share: ₩44.26T |
₩120.0T | 34.8% (Est.) |
| Basic EPS (KRW) | ₩4,950 | ₩6,605 | — | As filed. Diluted FY2025: ₩6,603 |
| Return on Equity (ROE %) | 8.6% | 10.4% | — | 10.4% (2025 ROE, actual) |
Basis. 2024 and 2025 are consolidated (연결) figures from the FY2025 annual report, DART rcpNo 20260310002820. “Net Profit” is the 당기순이익 line; “owners’ share” is 지배기업 소유주지분. ROE = net profit attributable to owners ÷ closing equity attributable to owners (₩391.69T in 2024, ₩424.31T in 2025) — a closing-equity, not average-equity, calculation. EPS as filed is struck across common and preferred shares together. The 2026 column is an estimate published with this report on 3 July 2026, not a filing; we have left the 2026 ROE blank rather than restate a forward number we cannot reproduce.
Margin Expansion and Operating Leverage
In the semiconductor industry, fixed manufacturing costs—primarily the massive depreciation of wafer fabs and extreme ultraviolet (EUV) lithography systems—are extraordinarily high. When global demand recovers and fab utilization rates rise toward 95%, fixed-cost dilution triggers substantial operating leverage.
For Samsung, every 10% increase in the Average Selling Price (ASP) of premium DRAM translates to an estimated ₩4 to ₩5 Trillion increase in quarterly operating profit, directly fueling the margin expansion seen in 2026.
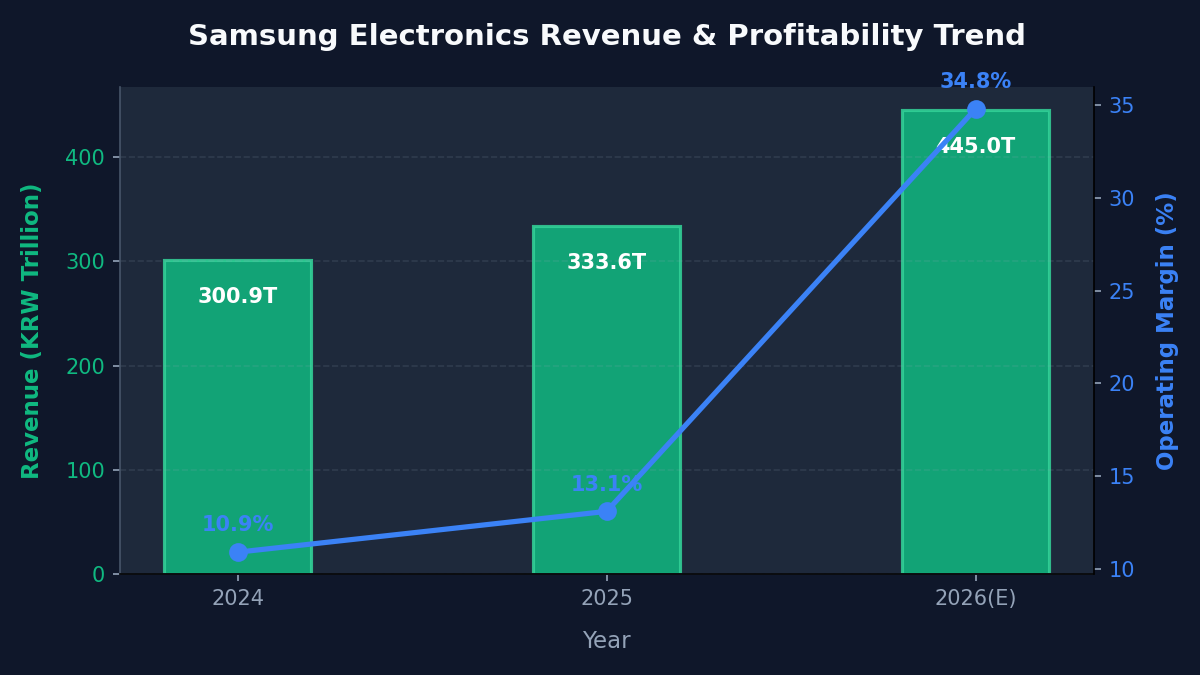
Figure: Dynamic Revenue Expansion and Operating Margin Trajectory
💡 Lingo Check: Understanding HBM and Foundry
To follow Samsung’s technical strategy, let’s look at three key concepts:
– HBM (High Bandwidth Memory – 고대역폭 메모리): A high-performance 3D-stacked DRAM interface used in conjunction with high-performance graphics accelerators and AI processors (like NVIDIA’s GPUs) to accelerate AI training and inference.
– Foundry (파운드리): A specialized semiconductor fabrication plant that manufactures microchips designed by fabless companies (such as Apple, NVIDIA, and AMD). Samsung operates both a traditional memory business and a contract manufacturing foundry division.
– Profit attributable to owners of the parent (지배기업 소유주지분): The slice of consolidated net profit that belongs to the parent company’s own shareholders, after the share belonging to minority holders of consolidated subsidiaries (비지배지분) is removed. It is the line a shareholder’s earnings per share is built from, and it is the line this report previously got wrong.
🚀 HBM Supply Chain Integration: The Ultimate Growth Catalyst
The most critical driver of Samsung’s 2026 valuation is its positioning within the global High Bandwidth Memory (HBM) supply chain. While competitors like SK Hynix secured an early lead in supplying HBM3 to NVIDIA, Samsung has closed the gap by qualifying its next-generation HBM3E (8-stack and 12-stack) products.
HBM3E Qualification and Volume Shipments
Following rigorous testing phases throughout 2024 and 2025, Samsung successfully began mass deliveries of its 12-layer HBM3E chips to major AI chip makers in early 2026. The company’s massive CapEx capacity has allowed it to scale production lines faster than competitors, capturing a substantial share of the high-margin HBM3E market.
Developing HBM4 Custom Architectures
Looking forward, Samsung is preparing for the HBM4 generation, scheduled for pilot production by late 2026. Unlike previous generations, HBM4 requires custom logic dies that are fabricated using advanced foundry nodes. Samsung’s unique position as both an advanced memory maker and a leading-edge foundry operator allows it to offer fully integrated, turn-key HBM4 solutions. Our SK Hynix HBM4E note sets out the competing approach.
🔬 Foundry and System LSI Outlook
While memory drives the current earnings cycle, Samsung’s advanced foundry division is key to its long-term re-rating.
Gate-All-Around (GAA) 3nm and 2nm Nodes
Samsung was the first in the industry to adopt the Gate-All-Around (GAA) transistor architecture at the 3nm node. In 2026, the company is scaling its second-generation 3nm GAA process (SF3) and preparing for the mass production of its 2nm (SF2) node. Securing major mobile and HPC (High-Performance Computing) customers remains the primary focus to challenge TSMC’s dominance.
Yield Optimization and Profitability
The primary bottleneck for the foundry division has been yield optimization (수율 안정화). Significant investments in automated design tools and AI-driven defect inspection have stabilized 3nm yields above 60% in early 2026. This optimization is reducing losses and bringing the foundry division closer to sustained profitability.
⚖️ Valuation & Global Peer Comparison
To determine whether Samsung Electronics was fairly valued on 3 July 2026, we compare its multiples against global semiconductor leaders. The Samsung line below has been recomputed; see the correction note at the top of this page.
Multiples Matrix (3 July 2026)
– Samsung Electronics (KRX: 005930): Forward P/E 15.08× (common only) · 16.47× (all share classes) | ROE 10.4% (FY2025 actual) | EV/EBITDA 5.8x (as published, not re-verified). Arithmetic: ₩309,500 × 5,846,278,608 issued common shares = ₩1,809.42T ($1.173tn) of market value; divided by this report’s own ₩120T estimate for 2026 net profit = 15.08×. Adding the 802,371,203 issued preferred shares at the common’s price gives ₩2,057.76T and 17.15× — but the preferred does not trade at the common’s price. At its own settled close of ₩208,000 on 3 July 2026 the preferred was worth ₩166.89T, so all classes together came to ₩1,976.32T ($1.282tn) and 16.47×. That is the figure to use: it is what the market actually capitalised the company at, and it lands inside the 15.08–17.15× range rather than at either end of it. Share counts and prices from the KRX settled listing for 3 July 2026, cross-checked against DART rcpNo 20260814003699; financials from DART rcpNo 20260310002820. On FY2025 actual EPS of ₩6,605 the trailing multiple at that price was 46.9× — a per-share ratio, so the share-count correction does not touch it.
– TSMC (NYSE: TSM): Forward P/E 23.5x | EV/EBITDA 12.2x | ROE 31.0%
– Micron Technology (NASDAQ: MU): Forward P/E 15.2x | EV/EBITDA 8.9x | ROE 18.2%
– Intel Corporation (NASDAQ: INTC): Forward P/E 21.0x | EV/EBITDA 9.8x | ROE 8.5%
The TSMC, Micron and Intel figures are reproduced as published with this report on 3 July 2026. We have not re-verified them against those companies’ own filings, and they should not be treated as sourced.
Valuation Analysis, Re-examined
The discount to Micron disappears once the multiple is computed correctly. This section originally read Samsung at 10.5× forward earnings against Micron at 15.2× and called the gap significant. At ₩309,500 across 5,846,278,608 common shares the company was carrying roughly ₩1,809T ($1.17tn) of market value; against the ₩120T of 2026 net profit this report projected, that is 15.08× — the same multiple, to within a rounding error, as the Micron figure it was being compared against. Count every class at its own 3 July close and the capitalisation rises to ₩1,976T ($1.28tn) and the multiple to 16.47×, which is above Micron rather than below it.
The profitability half of the comparison also needs restating. Samsung’s reported return on equity in FY2025 was 10.4% (₩44.26T attributable to owners on ₩424.31T of closing owners’ equity), not the 24.2% this report originally quoted here — that was a forward estimate for 2026, and presenting it beside peers’ figures without saying so overstated the case.
What is left is a structural argument rather than a numerical one. Samsung carries a complex corporate structure spanning consumer electronics and displays alongside chips, and it has been late to the HBM supply chain. Those are real reasons for a lower multiple than a pure-play foundry. Whether HBM3E scaling and GAA yield improvements close that gap is a question about execution, and it cannot be settled by a multiple that was mis-stated.
⚠️ Potential Risk Factors
Investors must remain aware of the key risks facing Samsung’s multi-layered business:
– Foundry Customer Acquisition: If Samsung fails to secure major fabless customers for its 2nm GAA node, it may struggle to justify its massive foundry CapEx.
– Geopolitical and Trade Tension: With production facilities in South Korea, China, and the US, Samsung is highly exposed to shifting semiconductor export controls and geopolitical tensions.
– AI Infrastructure CapEx Slowdown: A sudden reduction in AI infrastructure investments by US hyperscalers (such as Microsoft, Google, and Meta) could lead to an oversupply of HBM and high-density DRAM.
🛡️ Conclusion
The operational case this 3 July 2026 note made still reads: HBM3E qualification, rising server DRAM prices, and a foundry division moving toward break-even give Samsung real earnings visibility into the 2026 cycle, with foundry market share the long-term open question. The valuation case does not. At ₩309,500 the shares were trading at 15.08× this report’s own ₩120T estimate for 2026, or 16.47× counting the preferred at its own close — level with or above the Micron multiple it was supposedly cheap against, and 46.9× FY2025 actual earnings — not the 10.5× originally printed. The ₩410,000 target discussed at the time is recorded in the box above as history and is not carried forward.
Where the numbers are now. This is a valuation note written on 3 July 2026. For the divisional picture taken straight from the half-year filing — which arm actually earns the operating profit, how much of the asset base sits behind it, and which of the three Samsung Electronics tickers you are buying — see Samsung Electronics (005930): Which Division Earns the Money, and Which Ticker You’re Buying (H1 2026).
*Disclaimer: This report is for informational purposes only and does not constitute investment advice. Investors should conduct their own research before making financial decisions.*