📌 As of 3 July 2026 — a point-in-time view. Financials corrected 30 August 2026. For our current, filings-based view of the company, see SK hynix: what it actually makes, who buys it, and where the money goes.
Update — 9 August 2026. The valuation framing below was written when the shares were ₩2,425,000; they closed at ₩1,422,000 on 7 August. Our later analysis of the Q2 accounts supersedes it: on operating profit alone the multiple is 7.2×, and roughly half of the record quarter sat in a non-operating line that has since reversed in the market. Treat the rating and target below as historical.
Further update — 29 August 2026. One more claim below is superseded: the argument that “an ROE of 96.0% combined with a 68.0% operating margin is indicative of a high-growth platform monopoly rather than a cyclical commodity maker.” SK hynix’s return on equity has since printed +3.5% (FY2022), −17.1% (FY2023), +26.8% (FY2024) and +35.6% (FY2025) on its audited consolidated accounts, and its equity base more than doubled in the six months to June 2026 — so annualising a half-year against it produces an ROE above 100%. ROE is not a usable measure of quality for this company; it mostly reports where you are standing in the memory cycle. Our earnings-quality analysis and our company reference article set out the multi-year figures. Treat the ROE framing below, like the rating and target, as historical.
✏️ Correction — 30 August 2026. The FY2024 and FY2025 net-income and ROE figures shown in the table below were wrong. We printed net profit of ₩18.20T (2024) and ₩36.50T (2025); SK hynix’s audited consolidated accounts report ₩19.797T and ₩42.948T (₩19.789T and ₩42.919T attributable to owners of the parent). We printed ROE of 18.2% and 45.5%; on the same accounts it is 26.8% and 35.6%. The valuation multiples that rested on those figures were also wrong and have been recomputed from the report’s own price and share count: forward P/E 7.0× → 13.4×, P/B 2.8× → 14.6× (that share count was itself stale — see the further correction below; the figures are 13.09× and 14.34×). The peer line showing Samsung Electronics at 54.0% ROE had no source and has been replaced with the filed figure. Revenue and operating profit were checked against the same filing and were correct — they are unchanged. Source: DART, FY2025 annual report, rcpNo 20260317000635. See our corrections policy.
✏️ Further corrected — 30 August 2026 (second pass). The share count used in the correction above was three months out of date. We computed market value on 728,002,365 shares, the issued total at 31 December 2025. The share-total schedule of the FY2025 annual report (rcpNo 20260317000635) shows 728,002,365 shares issued at that date; the same schedule in the Q1 2026 report shows 712,702,365 at 31 March 2026 — 15,300,000 fewer. That was on file three months before the 3 July 2026 price this report is written against, and the Korea Exchange listed exactly 712,702,365 shares on that day. The multiples have been recomputed: market value ₩1,765T ($1.14tn) → ₩1,728.30T ($1.121tn), forward P/E 13.4× → 13.09×, P/B 14.6× → 14.34×. The conclusion does not change — at 13.09× the shares were still priced above the 10.0× this report lists for Micron, so the “discount” reading remains wrong. Source: DART Q1 2026 report, rcpNo 20260515002287, cross-checked against the KRX settled listing for 3 July 2026.
One further disclosure, unrelated to the filings. The original 3 July text carried two different target prices — ₩3,200,000 in its header box and ₩2,950,000 in its conclusion. We have kept the header figure of ₩3,200,000 throughout rather than resolve the contradiction silently, and record it here. Neither figure is a view we hold; we do not publish target prices.
- 💰 FY2025 on the record: revenue ₩97.15T, operating profit ₩47.21T (48.6% margin), net profit ₩42.95T, basic EPS ₩62,044. (Source: DART rcpNo 20260317000635)
- ⚖️ Not the discount this report claimed: at the ₩2,425,000 price it was written against, the forward multiple on its own 2026 estimate was 13.09× and book value 14.34× — not 7.0× and 2.8×. See the correction above.
- 🔄 The pivot is the durable part: slowing the HBM4 ramp to feed commodity DDR5 was the operating decision this piece set out to analyse, and that analysis stands independently of the multiple.
💵 Price at writing (3 July 2026, KRX settled close): $1,573 (₩2,425,000)
🎯 Target discussed (3 July 2026): $2,075 (₩3,200,000)
📈 Implied upside at the time: 31.9%
Both figures are the point-in-time record of what this report said on 3 July 2026. Neither is a current view, and we do not publish target prices. FX ₩1,542/$ (USD/KRW, 2 Jul 2026, FinanceDataReader).
*Market Report as at 3 July 2026*
SK Hynix HBM4E Outlook: Strategic Pivot to Commodity DRAM and 12-Layer Domination
SK Hynix (KRX: 000660) has once again demonstrated its tactical agility and technological leadership in the global semiconductor sector. In June 2026, the company officially commenced shipping samples of its next-generation 12-layer HBM4E (High Bandwidth Memory 4 Extended) to major global graphics processing unit (GPU) developers. This milestone solidifies its position as the premium memory supplier of choice for AI accelerators. SK Hynix is one of the two engines of Korea’s chip supercycle — the AI-driven memory boom that turned HBM into a scarce strategic asset.
Concurrently, a significant strategic pivot is underway at SK Hynix’s production facilities. The company has decided to adjust the pace of its HBM4 capacity expansion to reallocate key equipment and cleanroom resources toward advanced commodity DRAM, particularly DDR5. Driven by an unprecedented supply shortage and soaring profit margins in the conventional server DRAM space, this strategic realignment optimizes near-term cash flows while maintaining a commanding lead in the premium AI memory segment. This report offers a comprehensive analysis of SK Hynix’s dual-engine strategy, its structural cost advantages, and a global peer valuation comparison.
📈 Financial Trajectory and the Dual-Engine Strategy
SK Hynix’s financial trajectory has transitioned from cyclical commodity-dependent volatility to secular technology franchise growth. The combination of high-margin custom HBM contracts and a cyclical recovery in conventional DRAM has generated record-breaking performance.
Three-Year Financial Summary
The following table sets out the scale of the change and the structural margin expansion. The 2024 and 2025 columns are the audited consolidated figures as filed with DART; the 2026 column is an estimate made on 3 July 2026 reflecting a severe commodity DRAM shortage, high HBM pricing premiums, and optimized capacity utilization.
| Financial Metric | 2024 (Actual) | 2025 (Actual) | 2026 (Est.) | Operating Margin & ROE Trend (Visual) |
|---|---|---|---|---|
| Revenue (KRW Trillion) | ₩66.19T | ₩97.15T | ₩250.00T | 35.5% (2024 OP Margin) |
| Operating Profit (KRW Trillion) | ₩23.47T | ₩47.21T | ₩170.00T | 48.6% (2025 OP Margin) |
| Net Profit — 당기순이익(손실) (KRW Trillion) | ₩19.80T owners’ share: ₩19.79T |
₩42.95T owners’ share: ₩42.92T |
₩132.00T | 68.0% (2026 OP Margin Est.) |
| Basic EPS (KRW) | ₩28,732 | ₩62,044 | — | As filed. Diluted FY2025: ₩60,378 |
| Return on Equity (ROE %) | 26.8% | 35.6% | n/m | 35.6% (2025 ROE, actual) |
Basis. 2024 and 2025 are consolidated (연결) figures from the FY2025 annual report, DART rcpNo 20260317000635, filed 17 March 2026. “Net Profit” is the 당기순이익(손실) line; “owners’ share” is 지배기업의 소유주지분. ROE = net profit attributable to owners ÷ closing equity attributable to owners (₩73.90T in 2024, ₩120.52T in 2025) — a closing-equity, not average-equity, calculation. The 2026 column is an estimate published with this report on 3 July 2026, not a filing. 2026 ROE is shown as not meaningful: the equity base moves faster than the earnings in a memory upcycle, so the arithmetic produces figures above 100% (see the 29 August note at the top of this page).
Driving Forces Behind Margin Expansion
The primary driver of the 68.0% operating margin estimated for 2026 is the pricing dynamics of high-density server memory. While premium HBM products are sold under fixed-price Long-Term Agreements (LTAs) with high single-digit and double-digit premiums, the spot and contract prices for conventional server DDR5 have spiked due to industry-wide capacity constraints.
Since high-density HBM packaging requires up to three times the wafer capacity of conventional DRAM, the industry’s focus on HBM has starved the market of commodity DRAM. By strategically pausing the ramp-up of the next-generation HBM4 lines, SK Hynix is capturing very high margins on legacy and mainstream DRAM lines, ensuring that cash generation remains highly diversified.
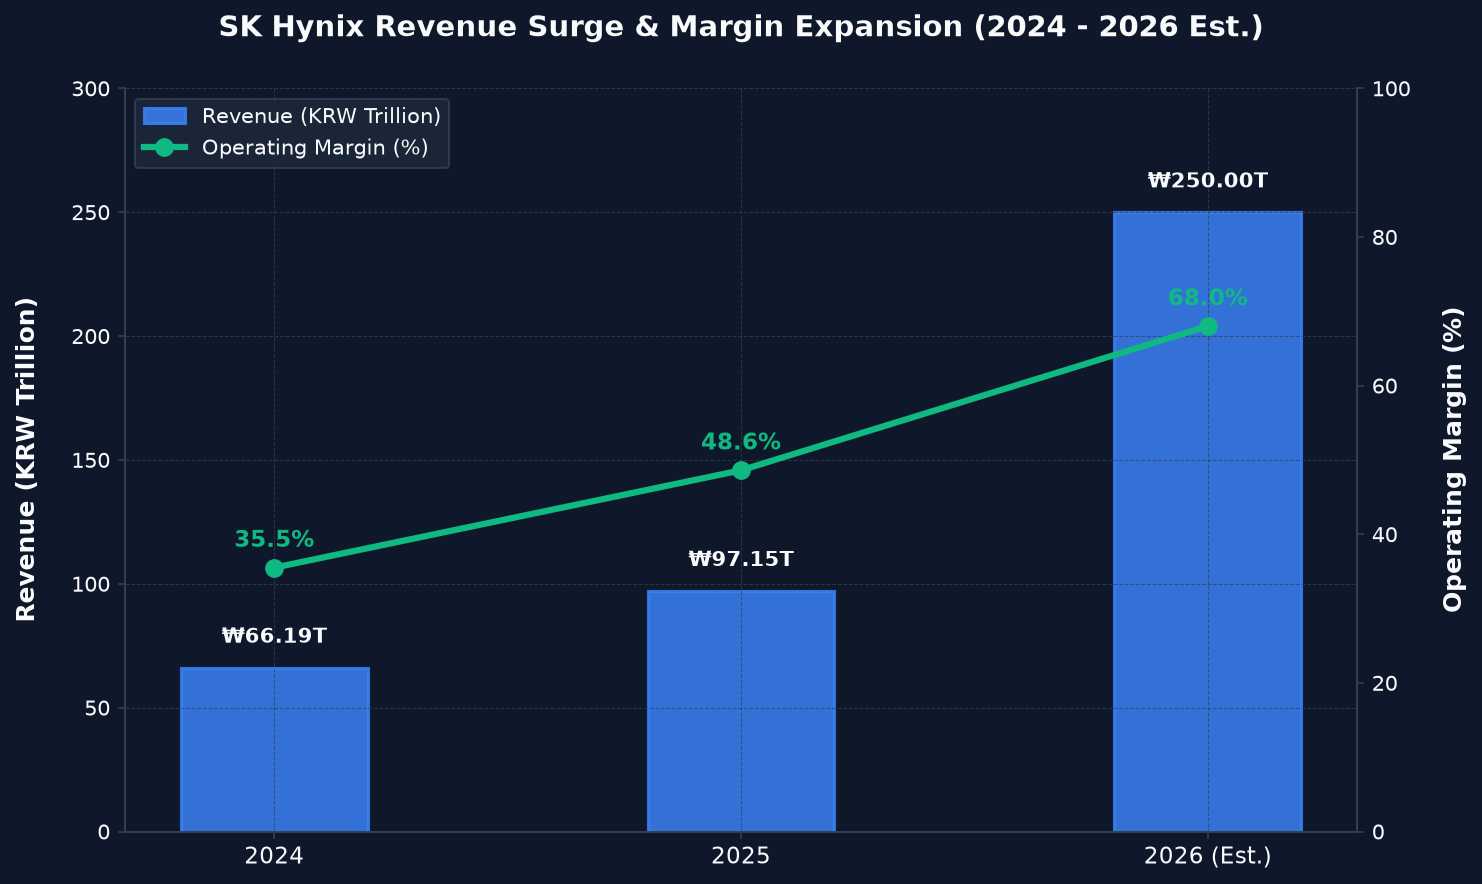
Figure: Revenue Surge and Historic Expansion of Operating Margins
💡 Lingo Check: Key Industry Terms and Regulatory Entities
Understanding the strategic changes at SK Hynix requires familiarity with the following terminology:
– Commodity DRAM (범용 DRAM): Standardized memory chips used in servers, PCs, and smartphones. Unlike HBM, which is customized, commodity DRAM is subject to market supply-demand cycles.
– HBM4E (6세대 HBM 확장형): The extended iteration of the sixth-generation High Bandwidth Memory, boasting increased vertical stacking capabilities and enhanced processing bandwidth.
– Advanced MR-MUF (개량형 매스 리플로우 몰디드 언더필): SK Hynix’s proprietary packaging technique that applies liquid protective material to stacked memory chips, offering superior heat dissipation and manufacturing yield compared to conventional thermal compression film methods.
– Profit attributable to owners of the parent (지배기업의 소유주지분): The slice of consolidated net profit that belongs to the parent company’s own shareholders, after the share belonging to minority holders of consolidated subsidiaries (비지배지분) is stripped out. It is the line a shareholder’s earnings per share is built from.
– Financial Supervisory Service (금융감독원 – FSS): The primary financial regulatory body in South Korea overseeing corporate disclosures.
– DART (전자공시시스템): The repository managed by the FSS where corporate financial reports and material disclosures are officially filed.
🚀 Technological Hegemony: 12-Layer HBM4E and the Advanced MR-MUF Advantage
SK Hynix’s early technological bets have created an exceptionally wide competitive moat in the high-density packaging domain.
The Advanced MR-MUF Moat
While competitors like Samsung Electronics (삼성전자) have faced yield challenges in scaling their 12-layer and 16-layer packaging using traditional Thermal Compression Non-Conductive Film (TC-NCF), SK Hynix has mastered Advanced MR-MUF. This technology replaces the thick film layer with an optimized liquid underfill that is applied under high temperature and pressure, minimizing void formation and improving thermal dissipation by up to 2.5 times. The recent delivery of 12-layer HBM4E samples represents the pinnacle of this technological packaging capability, offering 16 Gbps bandwidth per pin and superior energy efficiency, making it the preferred solution for next-generation AI nodes.
TSMC Alliance and Custom Logic Die Integration
Beginning with the HBM4 generation, the technological complexity of memory increases exponentially. Instead of using a memory-based base die (logic die), the memory stack must interface directly with customized logic dies manufactured on advanced foundry nodes.
SK Hynix has solidified a strategic alliance with TSMC to produce these custom logic dies. This integration allows SK Hynix to focus on memory stacking and Advanced MR-MUF packaging, while leveraging TSMC’s industry-leading 3nm and 5nm processes. This collaborative ecosystem creates a formidable barrier to entry for single-source competitors who attempt to build both logic and memory components in-house.
🔄 The Tactical Pivot: Pausing HBM4 Expansion to Monetize Server DRAM
The decision to slow the physical ramp-up of HBM4 capacity in late 2026 is a calculated tactical pivot designed to maximize absolute profit pool capture.
The Server DRAM Shortage Catalyst
The global transition of standard cloud servers to AI-hybrid infrastructure has led to a major upgrade cycle. Cloud Service Providers (CSPs) are buying up massive volumes of DDR5 RDIMMs and high-capacity Enterprise SSDs (eSSDs). Because memory makers have converted significant wafer capacity from standard DRAM to HBM, the supply of standard DRAM has dropped significantly.
– Operating Margin Parity: Advanced DDR5 products are now achieving operating margins comparable to HBM due to the supply deficit.
– CapEx Optimization: By utilizing existing legacy cleanrooms for DDR5 expansion instead of building out capital-intensive new HBM4 packaging lines prematurely, SK Hynix is optimizing its capital expenditure efficiency.
– Yield Security: Pausing the HBM4 ramp allows the company’s engineers to refine the TSMC custom base die packaging yields, reducing execution risks.
⚖️ Valuation & Global Peer Comparison
SK Hynix commands the strongest technical moat in AI packaging and generates industry-leading returns. Whether it was also cheap on 3 July 2026 is a separate question, and the arithmetic below answers it differently from the way this report originally did.
Peer Multiples Comparison (3 July 2026)
– SK Hynix (KRX: 000660): Forward P/E 13.09× | P/B 14.34× | ROE 35.6% (FY2025 actual). Arithmetic: ₩2,425,000 × 712,702,365 issued shares = ₩1,728.30T ($1.121tn) of market value; divided by the ₩132T 2026 net-profit estimate in the table above = 13.09×, and divided by FY2025 closing equity attributable to owners of ₩120.52T ($78.2bn) = 14.34×. Share count from the DART Q1 2026 report, rcpNo 20260515002287, and confirmed against the KRX settled listing for 3 July 2026; equity from rcpNo 20260317000635. The report originally printed 7.0× and 2.8×; our first correction printed 13.4× and 14.6× on a share count that was three months stale.
– Samsung Electronics (KRX: 005930): ROE 10.4% — FY2025 actual, net profit attributable to owners of ₩44.26T on closing equity attributable to owners of ₩424.31T (Source: DART rcpNo 20260310002820). This line previously showed 54.0%. We could not find any source for that figure and it contradicted the filed accounts, so it has been replaced. See our Samsung Electronics valuation note.
– Micron Technology (NASDAQ: MU): Forward P/E 10.0x | ROE 38.0% | P/B 3.2x
– TSMC (NYSE: TSM): Forward P/E 25.0x | ROE 35.0% | P/B 6.8x
The Micron and TSMC figures are reproduced as published with this report on 3 July 2026. We have not re-verified them against those companies’ own filings, and they should not be treated as sourced.
Share-count basis. We count issued (listed) shares, which is the basis the Korea Exchange itself uses to strike market capitalisation and which includes stock the company holds in treasury. At 31 March 2026 — the last position filed before this report’s price date — SK hynix held 4,405,344 treasury shares, of which 2,753,353 were deposited with the Korea Securities Depository as collateral for an exchangeable bond issued in April 2023 (DART rcpNo 20260515002287, notes to the share-total schedule). Stripping treasury out entirely gives 708,297,021 shares, ₩1,717.62T of market value, and multiples of 13.01× and 14.25× — the choice of basis moves the answer by well under 1%, so it does not carry any of the argument here.
The Valuation Re-rating Thesis, Re-examined
The discount argument does not survive the corrected arithmetic. This section originally read SK Hynix at 7.0× forward earnings against Micron at 10.0× and TSMC at 25.0×, and called the gap unjustified. At ₩2,425,000 across 712,702,365 issued shares the company was carrying roughly ₩1,728T ($1.12tn) of market value. Against the ₩132T of 2026 net profit this very report projected, that is 13.09×; against FY2025 closing equity it is 14.34× book. Relative to the peers listed above, SK Hynix was not trading at a discount — it was priced ahead of them, on an estimate that had not happened yet.
What survives is narrower, and worth keeping. The market has historically priced SK Hynix as a cyclical memory vendor rather than a franchise, and multi-year LTAs plus advanced-packaging lock-in are legitimate reasons to test that framing. But the case has to be argued from the business, not from the multiple: the multiple in the original text was an arithmetic error, and the profitability ratios it leaned on move with the memory cycle rather than measuring quality (see the 29 August note above).
⚠️ Potential Risk Factors
While the outlook is highly positive, investors should monitor the following risk factors:
– Samsung’s HBM Certification Rebound: If Samsung Electronics successfully passes advanced HBM3E and HBM4 qualification tests for key AI clients, the supply constraints will ease, potentially reducing pricing premiums.
– TSMC Foundry Allocation Limits: Because SK Hynix relies on TSMC for its base logic dies, any capacity constraints at TSMC’s advanced nodes could directly limit HBM4 shipments.
– Geopolitical Concentration: High manufacturing concentration within South Korea remains a structural risk factor for global asset managers.
🛡️ Conclusion
SK Hynix’s dual-engine strategy — leveraging 12-layer HBM4E technological superiority while harvesting cash from the commodity server DRAM shortage — was the substance of this 3 July 2026 note, and that description of the business still stands, supported by a robust capital structure and the TSMC alliance. The valuation case built on top of it does not. At ₩2,425,000 the shares were trading at 13.09× the 2026 net-profit estimate used here and 14.34× FY2025 book value, not the 7.0× originally printed, so the “exceptional entry point” claim was arithmetic, and the arithmetic was wrong. The ₩3,200,000 target discussed at the time is recorded in the box above as history and is not carried forward — and the original text carried a second, contradictory figure of ₩2,950,000 in this position, which is disclosed in the correction note at the top of this page. For where the story actually went, read the August 2026 updates at the top of this page.
*Disclaimer: This report is for informational purposes only and does not constitute investment advice. Investors should conduct their own research before making financial decisions.*
Written by James Ju — a Seoul-based engineer who reads Korean-language DART and KRX filings, the primary sources most English-language coverage skips. About the author.