📌 As of 3 July 2026 — a point-in-time view. Financials corrected 30 Aug 2026.
✏️ Corrected 30 Aug 2026 — every one of the six figures in this report’s original financial table was wrong, and the errors ran in the direction of understating the company.
| Item | As published | Audited (연결) |
|---|---|---|
| Revenue FY2024 | ₩12.5tn | ₩14.486tn |
| Revenue FY2025 | ₩13.8tn | ₩17.581tn |
| Operating profit FY2024 | ₩0.54tn | ₩0.705tn |
| Operating profit FY2025 | ₩0.72tn | ₩2.038tn (2.8× higher) |
| Net income FY2024 | ₩0.32tn | ₩0.622tn |
| Net income FY2025 | ₩0.45tn | ₩1.415tn |
The published ₩12.5tn and ₩13.8tn do not match FY2023 (₩11.964tn), FY2024, or FY2025. They were not a year-labelling slip; they had no traceable source.
Three further corrections follow from that base. The report projected “expanding operating margins toward 8% by late 2026” — FY2025’s actual operating margin was already 11.59%, so the target had been passed before the article was written. The forward P/E of 24.5x is arithmetically inconsistent with the price printed beside it: that price and the article’s own ₩0.85tn 2026 estimate give 71×. The stale second price of ₩242,000 that also appeared in the price box gives 29.9× — still not 24.5x, but in the same neighbourhood, which is the signature of a price that was updated while the multiple was left behind. The published ROE of 12.8% matched neither the article’s own table (4.8%) nor the audited accounts (15.2% on year-end equity). All three have been recalculated or withdrawn, the stale second price has been removed, and the article’s failure to mention an 18.2% increase in the share count has been fixed.
Source: DART rcpNo 20260320000859 (FY2025 annual report, filed 20 Mar 2026). See our corrections policy.
- 📈 The margin cycle turned harder than anyone published: the consolidated operating margin went 1.49% → 4.87% → 11.59% across FY2023–FY2025. Operating profit nearly tripled in FY2025 alone, to ₩2.038tn. (Source: DART rcpNo 20260320000859)
- 🧾 The order backlog is ₩56.384tn at 31 Dec 2025, of which ₩44.351tn is shipbuilding — and ₩11.376tn of it arrived through a merger, not through new orders.
- 🔀 The share count rose 18.2% in December 2025 — from 88,773,116 to 104,961,225 — as merger consideration for absorbing HD Hyundai Mipo. FY2025 earnings per share are struck on a weighted average of about 90.1M shares, not the 105.0M now outstanding.
- 🪨 Steel plate really is getting cheaper: ₩1,130,000/t in 2023 → ₩958,500 in 2024 → ₩914,000 in 2025, on the filing’s own SteelDaily benchmark.
📌 Point-in-time record — 3 July 2026. Not a live quote.
Share price at time of writing: ₩577,000 — the KRX settled close on 3 July 2026, the last trading day before this report was published (Source: KRX). Shares in issue: 104,961,225 → market capitalisation of about ₩60.6tn at that price. A second price of ₩242,000 appeared in the original box; it was stale and has been removed.
Target price as originally published: ₩820,000 — retained for the record and withdrawn as a view. It rested on revenue and profit figures now known to be wrong. We have not issued a replacement, and the original “upside potential” line has been removed because it was arithmetic on a withdrawn number.
Original market report: 3 July 2026. Financials corrected 30 August 2026.
HD Hyundai Heavy Industries Valuation: Clean Shipping Cycle and Naval MRO Expansion
HD Hyundai Heavy Industries (KRX: 329180), the flagship shipbuilding subsidiary of HD Hyundai Group, operates its primary yard in Ulsan, South Korea, building commercial vessels, offshore engineering platforms, naval combatants, and marine engines. On 1 December 2025 it absorbed HD Hyundai Mipo in a merger that lifted its stated shipbuilding capacity from 10,000 thousand GT to 12,467 thousand GT and added ₩11.376tn to its order book.
Global maritime environmental rules are forcing shipowners to replace legacy fleets, and the industry is in a multi-year clean-vessel cycle. This report values HD Hyundai Heavy Industries on the audited FY2023–FY2025 accounts, the filing’s own backlog and raw-material tables, and the 3 July 2026 close — not on the estimates the original version of this article published.
📈 What Do HD Hyundai Heavy Industries’ Actual Financials Look Like?
The operating margin went from 1.49% in FY2023 to 4.87% in FY2024 to 11.59% in FY2025 — the cycle turned far harder than the original article’s “toward 8% by late 2026” projection, which had already been overtaken by the audited result.
| Consolidated (연결재무제표) | FY2023 | FY2024 | FY2025 |
|---|---|---|---|
| 매출액 Revenue | ₩11.964tn | ₩14.486tn | ₩17.581tn |
| 영업이익 Operating profit | ₩0.179tn | ₩0.705tn | ₩2.038tn |
| Operating margin (computed) | 1.49% | 4.87% | 11.59% |
| 당기순이익 Net income (total) | ₩0.025tn | ₩0.622tn | ₩1.415tn |
| — 지배기업의 소유주지분 attributable to owners | ₩0.025tn | ₩0.622tn | ₩1.415tn |
| 기본주당이익 Basic EPS | ₩278 | ₩7,001 | ₩15,702 |
| 자본총계 Total equity | ₩5.207tn | ₩5.704tn | ₩9.342tn |
| 발행주식수 Shares in issue | 88,773,116 | 88,773,116 | 104,961,225 |
Source: DART annual report FY2025, rcpNo 20260320000859, filed 20 Mar 2026 — consolidated (연결) statements. Figures are quoted in the filing’s own currency and units. Operating margin computed by us. Non-controlling interests are negligible at this company (₩140,000 of equity and −₩209,000 of FY2025 income), so consolidated and attributable net income are the same to the nearest ₩0.001tn — unlike most Korean holding structures. Perimeter warning: HD Hyundai Mipo was absorbed with a merger date of 1 Dec 2025, so FY2025 contains roughly one month of it and FY2024 contains none. Part of the FY2025 revenue and backlog step-up is that merger, not organic growth. The original “2026 (Est.)” column has been removed rather than re-estimated: it was built on the erroneous base above, and we do not publish replacement forecasts inside a correction.
Why Shipbuilding Profits Arrive Late
In shipbuilding, profitability lags the contracting cycle. A commercial vessel takes two to three years from contract signing to delivery, so cheap orders signed in a downturn keep depressing margins long after freight rates recover — and the expensive, eco-specified contracts signed in 2022–2023 only reach the income statement now. FY2023’s 1.49% margin is the tail of the old book. FY2025’s 11.59% is the new one arriving.
Steel Plate: The Cost Side, With Numbers
Thick steel plate (후판) is the dominant input cost in commercial shipbuilding, and the annual report publishes the price it actually paid against. On the SteelDaily market benchmark the filing cites (SS275, 20T), plate averaged ₩1,130,000 per tonne in 2023, ₩958,500 in 2024, and ₩914,000 in 2025 — down 15.2% then a further 4.6%. Section beam (형강) followed the same path: ₩1,021,000 → ₩878,000 → ₩842,000. The filing attributes the moves to iron ore and coking coal prices.
So the original article’s cost thesis was right; only its margin arithmetic was wrong. Falling input prices and rising delivery prices arrived together, which is why the margin moved 6.7 percentage points in one year rather than the one-to-two points the article anticipated.
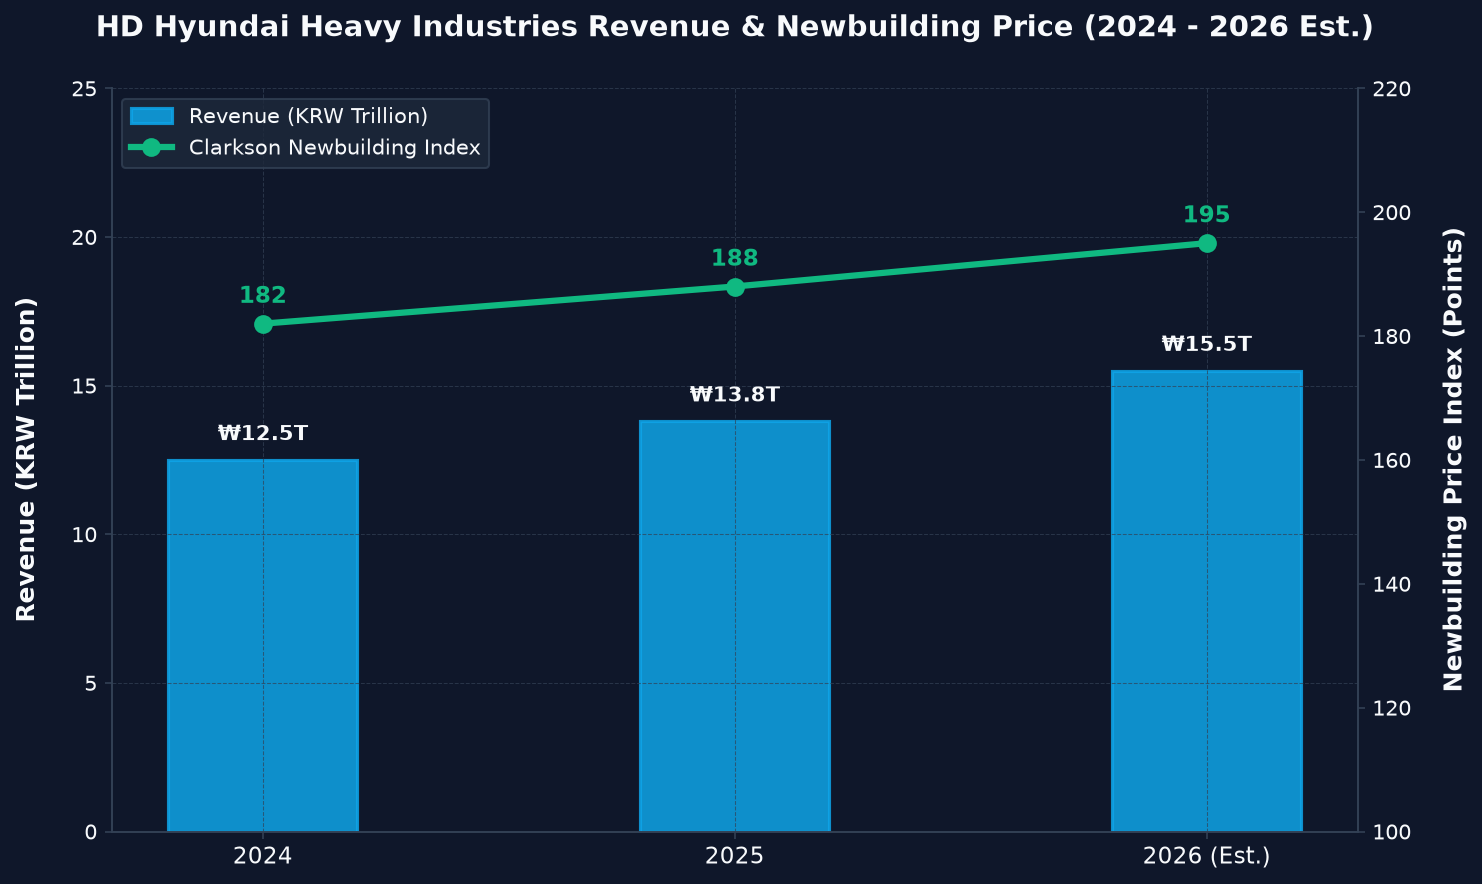
Figure: chart published with the original 3 July 2026 report. It was drawn from the revenue estimates corrected above and is retained only as a record of what was published; read the table, not the chart.
🔀 What Happened to the Share Count in December 2025?
HD Hyundai Heavy Industries issued 16,188,109 new shares — an 18.2% increase — as consideration for absorbing HD Hyundai Mipo, with a merger date of 1 December 2025. The original article did not mention it once.
This matters for anyone reading a per-share number. The filing’s capital note records shares in issue rising from 88,773,116 to 104,961,225, footnoted: “includes merger shares issued in the course of absorbing HD Hyundai Mipo.” The equity accounts show the same event as ₩8,254,952 million of share premium and −₩6,249,809 million of other capital surplus, both dated December 2025. This was not a rights issue; the only rights issue in the company’s capital history is from September 2021.
⚠️ The reported EPS is flattered by timing. FY2025 basic EPS of ₩15,702 is struck on a weighted average of roughly 90.1 million shares, because the merger shares only existed for the final month of the year. Divide the same ₩1.415tn of profit by the 104,961,225 shares that now exist and you get about ₩13,486 — 14.1% lower. The dilution is already in the share register; it is not yet fully in the reported EPS.
The offsetting fact is that the merger also brought Mipo’s earnings power and ₩11.376tn of backlog, of which FY2025 captured one month. Which effect dominates in FY2026 is a question the accounts cannot answer yet, and we are not going to guess at it here.
🧾 How Big Is the Order Book?
₩56.384tn at 31 December 2025, of which ₩44.351tn is shipbuilding — and the filing shows exactly how it got there.
| Segment | Opening backlog | From merger | Net new orders | Delivered | Closing backlog |
|---|---|---|---|---|---|
| 조선 Shipbuilding | ₩33.937tn | ₩11.376tn | ₩11.501tn | −₩12.463tn | ₩44.351tn |
| 해양플랜트 Offshore | ₩3.630tn | — | ₩0.054tn | −₩1.239tn | ₩2.445tn |
| 기타 Other (incl. engines & machinery) | ₩9.365tn | — | ₩4.102tn | −₩3.879tn | ₩9.588tn |
| 합계 Total | ₩46.932tn | ₩11.376tn | ₩15.657tn | −₩17.581tn | ₩56.384tn |
Source: DART annual report FY2025 (rcpNo 20260320000859), “II. Business Overview, 4. Order status,” base date 31 Dec 2025. The filing states the bridge explicitly: closing backlog = opening + net change − delivered. Two internal checks reconcile exactly: the shipbuilding row (33.937 + 11.376 + 11.501 − 12.463 = 44.351) and the delivered total, which equals FY2025 consolidated revenue of ₩17.581tn to the last million won. The filing notes that the “net new orders” column also absorbs FX revaluation on foreign-currency contracts and any cancellations or contract-value amendments, so it is not a clean gross-order figure.
💡 Lingo Check: Newbuilding Index, Dual-Fuel, and Absorption Merger
| Term | What it means |
|---|---|
| Clarkson Newbuilding Price Index (신조선가 지수) | An industry-standard index from Clarkson Research tracking prices for newly built commercial vessels. A rising index means yards have pricing power. |
| Dual-fuel propulsion (이중연료 추진) | Marine engines that can burn conventional fuel oil or a cleaner alternative — LNG, methanol, ammonia — letting a vessel meet tightening emission rules without being locked to one fuel supply chain. |
| Thick plate (후판) | Heavy steel plate, typically 6mm and above, that forms a ship’s hull. The single largest raw-material cost in commercial shipbuilding, and the reason steelmaker price negotiations move shipyard margins. |
| Absorption merger (흡수합병) | A merger in which one company survives and the other is dissolved into it, its shareholders paid in newly issued shares of the survivor. HD Hyundai Heavy Industries absorbed HD Hyundai Mipo this way on 1 December 2025, issuing 16,188,109 new shares. |
🚀 Eco-friendly Fleet Renewal: Capturing the Green Shift
HD Hyundai Heavy Industries’ competitive position rests on alternative marine propulsion. The International Maritime Organization’s carbon intensity indicator (CII) targets push shipowners off heavy fuel oil, and the yards that can build the replacement tonnage capture the premium slots.
High-margin LNG and Methanol Carriers
The company is a global leader in membrane-type LNG carriers and large dual-fuel methanol-enabled container ships. Its own strategy notes in the annual report describe expanding into carbon-neutral and carbon-reduction fuel propulsion — methanol and ammonia — as main and auxiliary engines, and pushing gas and dual-fuel engines and hybrid configurations. With a ₩44.351tn shipbuilding backlog against ₩12.463tn of vessels delivered in FY2025, the yard is carrying roughly three and a half years of shipbuilding work at current delivery rates.
Ammonia and Hydrogen Developments
Looking toward zero-carbon shipping, the company is securing early orders for Very Large Ammonia Carriers (VLACs); ammonia is regarded as both a hydrogen carrier and a clean marine fuel in its own right. HD Hyundai has developed proprietary cargo containment and fuel supply systems for it. This is a positioning claim rather than a disclosed revenue line, and we flag it as such.
🔬 Special Vessels and US Navy MRO
The special vessel division — destroyers, frigates, submarines — is the company’s route into higher-margin defense export work, and it is also the part of this report we can least support from the filings.
⚠️ Sourcing note, added 30 Aug 2026. The original article described progress toward qualifying for the United States Navy’s Master Ship Repair Agreement (MSRA). The term “MSRA” does not appear anywhere in the FY2025 annual report (rcpNo 20260320000859). We are leaving the passage below because the strategic logic is public and unchanged — US naval shipyard capacity is constrained and the Department of Defense is expanding MRO partnerships to allied nations — but readers should treat any specific HD Hyundai MSRA status as unconfirmed by company disclosure. Note also that the US Navy MRO contracts awarded to a Korean yard to date went to Hanwha Ocean, a different company, and their values have not been disclosed.
The special vessel division is bidding for naval contracts in Southeast Asia, South America, and Europe, and is presenting conventional submarine designs to global buyers — diversifying its defense order pipeline away from domestic procurement. On the FY2025 numbers this remains a small share of a ₩17.581tn revenue base; it is an option, not yet an earnings driver.
⚖️ What Does the Stock Actually Cost?
At the 3 July 2026 close of ₩577,000 the shares traded at about 42.8× FY2025 earnings on the full share count — not the 24.5× forward multiple the original article published, which could not be reproduced on any basis we tested.
The original multiples matrix quoted forward P/Es for HD Hyundai Heavy Industries, Samsung Heavy Industries, Hanwha Ocean, and Mitsubishi Heavy Industries, plus EV/EBITDA and ROE figures. None carried a source, and the HD Hyundai figures did not reconcile with the audited accounts. We have withdrawn the peer multiples rather than replace them with numbers we cannot trace to a primary filing. What follows is arithmetic you can reproduce.
| Measure (3 July 2026 close, FY2025 accounts) | Value |
|---|---|
| Market capitalisation (₩577,000 × 104,961,225 shares) | ₩60.56tn |
| P/E on FY2025 net income (₩1.415tn), full share count | 42.8× |
| P/E on reported basic EPS of ₩15,702 (weighted-average shares) | 36.7× |
| Price / book on total equity (₩9.342tn) | 6.48× |
| FY2025 ROE on year-end equity | 15.2% |
| FY2025 ROE on average equity | 18.8% |
| Market cap / FY2025 revenue (₩17.581tn) | 3.44× |
| Market cap / closing order backlog (₩56.384tn) | 1.07× |
All ratios computed by us. Price: ₩577,000 — the KRX settled close on 3 July 2026, which is the figure the original report used. Every multiple below is struck at that close; re-date it against the live quote before use. Share count 104,961,225 (KRX and the DART capital note, 3 July 2026). Earnings, equity, and backlog from DART rcpNo 20260320000859. Average equity is the mean of the FY2024 and FY2025 year-end figures (₩5.704tn and ₩9.342tn); because equity rose 63.8% during the year — largely through the December merger — the average-equity and year-end versions of ROE differ, so we show both. The original forward P/E of 24.5x, EV/EBITDA of 13.8x, ROE of 12.8%, and all four peer multiples are withdrawn as unsourced.
⚠️ Potential Risk Factors
⚠️ What could go wrong from here.
– The margin is at a cycle high, not a new normal. An 11.59% operating margin follows 1.49% two years earlier. Shipbuilding margins mean-revert with the contracting cycle, and today’s margin reflects contracts signed three years ago.
– The backlog is being worked down. Excluding the merger, FY2025 deliveries of ₩17.581tn exceeded net order additions of ₩15.657tn. A yard delivering faster than it books is converting backlog into revenue — good for this year, a question for the next.
– Dilution is not yet fully in reported EPS. On the current share count FY2025 EPS is about ₩13,486 rather than the reported ₩15,702.
– Steel plate pricing volatility. Plate has fallen three years running. A reversal by domestic steelmakers compresses margin on contracts already priced.
– Labour shortages. Korean shipbuilding faces structural shortages in welding and outfitting, which cap how fast a full order book can be delivered.
– Currency. Commercial vessel contracts are denominated in USD, so a strengthening won reduces the won value of revenue — and the filing notes that FX revaluation also flows through the reported backlog figure.
🎯 Why It Matters for K-Export Stars
The original version of this article understated FY2025 operating profit by ₩1.3tn and never mentioned an 18.2% increase in the share count — both of which were printed in a Korean-language filing available in March 2026. Neither error required a scoop to avoid; it required opening the document. That is the gap this site exists to close, and publishing the correction in full is part of the same commitment.
🛡️ Conclusion
Conclusion
HD Hyundai Heavy Industries in FY2025 earned ₩2.038tn of operating profit on ₩17.581tn of revenue — an 11.59% margin, up from 1.49% two years earlier. The clean-vessel cycle the original article described is real and further along than that article said. Input costs fell three years running, delivery prices rose, and the ₩56.384tn order book carries roughly three and a half years of shipbuilding at current delivery rates.
Two structural facts sit alongside that. The December 2025 absorption of HD Hyundai Mipo added 18.2% to the share count and ₩11.376tn to the backlog, and FY2025 captured only one month of the combined business — so neither the reported EPS nor the year-on-year backlog change means what it appears to mean. And the margin is at a cycle high reached from a very low base, which is the normal shape of this industry rather than a permanent re-rating.
We are not restating a target price. The original ₩820,000 target was derived from financial figures that were materially wrong, and the honest response to that is withdrawal, not replacement.
Disclaimer: This report is for informational and educational purposes only and does not constitute investment advice. Figures are point-in-time as noted and go stale; check the live quote and the current filings before acting. Investors should conduct their own research before making financial decisions.