Every English-language story about HYBE is a story about people: who is coming back, who is leaving, who is suing whom. The company’s own filings tell a different kind of story — one about accounting. In the year to December 2025, HYBE sold 17.5% more and earned 73% less. The reason is not in any press release. It is in a revenue-mix table, a goodwill footnote, and a tax line that turned a profit into a loss.
🔑 Key Takeaways
- The album business is shrinking — and it used to be nearly half the company. Albums and recorded music fell from 44.56% of revenue in FY2023 to 29.17% in FY2025, and fell 20.4% in absolute dollars. Group revenue still grew 21.7% over the same two years, because concerts (+112.7%) and merchandise (+75.3%) replaced it. (Source: DART FY2025 annual report, filed 20 Mar 2026)
- That swap is why profit collapsed. Gross margin fell from 46.3% (FY2023) to 35.3% (FY2025) as low-margin touring and merch displaced high-margin albums. Operating profit fell from $218.9M to $36.5M — down 83.3% in two years on 21.7% more revenue.
- HYBE wrote off $198.9M in FY2025 — 5.45× its entire operating profit. That includes $74.5M of goodwill, and the largest single goodwill write-down was Supertone, its AI-voice company, which lost 75.8% of its carrying goodwill (the $46.7M of other intangibles written off was larger still, but is not attributed to one unit) — and which HYBE’s board then resolved to dissolve in June 2026.
- The tax line, not the business, produced the loss. In H1 2026 HYBE reported a pre-tax profit of $23.7M and a net loss of $34.7M — an expected annual effective tax rate of 246.28%, consolidated — the figure the company itself prints in its half-year filing.
- HYBE has never cancelled a single share — and the treasury stock it does hold was given to it by its founder. Cumulative common shares retired since listing: zero, while the count rose 3.49% since end-FY2023. Bang Si-hyuk donated 546,120 of his own shares to the company in February 2026 and 192,126 more in May, on condition they be paid out to employees. The first-quarter cost of that gift — ₩255.0bn ($188.8M), a figure HYBE names in its own fair-disclosure filing — is the entire reason the first half of 2026 shows an operating loss. (Sources: DART fair disclosure, rcpNo 20260728800448, 28 Jul 2026, for the cost; rcpNo 20260429000828 and rcpNo 20260521000530 for the 546,120-share and 192,126-share donations.)
Currency and dating. Every won figure in this article is translated at a single rate — ₩1,350.36 / $1, the reference rate for 22 September 2026 — including figures drawn from filings covering FY2023–FY2025. Dollar amounts are therefore a single-rate translation, not period-average or transaction-date conversion; they are for comparison, not for restating HYBE’s accounts. Share prices are quoted in won first with dollars in parentheses, because a reader checking the Korea Exchange sees won. All prices are the settled close of 23 September 2026 from the Korea Exchange unless stated otherwise.
🏢 What Is HYBE, and What Does It Actually Sell?
HYBE is the Korean company that manages BTS, and at a $5.01bn market capitalisation it is the most valuable listed K-pop company — but only 29% of what it sells is music. The rest is concerts, merchandise, licensing, video content, fan-club subscriptions and a fan platform called Weverse.
Scope note: “most valuable listed K-pop company” is measured against the other listed Korean label groups — SM, JYP and YG — at settled Korea Exchange closes of 23 September 2026 (peer table below). It is not a claim about Asia: larger listed music companies trade elsewhere in the region.
The company was founded on 4 February 2005 as “The Big Hit Entertainment,” renamed Big Hit Entertainment three weeks later, listed on the KOSPI on 15 October 2020, and renamed HYBE Co., Ltd. on 30 March 2021. It is headquartered at 42 Hangang-daero, Yongsan-gu, Seoul — the Yongsan Trade Center — and the chief executive is Lee Jae-sang, appointed 12 September 2024. Founder Bang Si-hyuk stepped down as CEO on 1 July 2021 but remains an inside director and the largest shareholder. (Source: DART FY2025 annual report, “회사의 연혁” and “회사의 개요”; entity reference: Wikipedia — Hybe Corporation.)
HYBE runs what it calls a multi-label strategy: the filing states the company operates 15 independent labels across Korea, Japan and the United States, each with its own artist roster and creative leadership. That is the structural fact that matters most for an investor, because it means HYBE is a holding structure over many separate businesses — with separate minority shareholders, separate goodwill, and separate results.
The Korean labels named in the filing include Big Hit Music (BTS, TOMORROW X TOGETHER, CORTIS), Pledis Entertainment (SEVENTEEN, TWS), Source Music (LE SSERAFIM), ADOR (NewJeans), Belift Lab (ILLIT) and KOZ Entertainment (BOYNEXTDOOR); outside Korea, YX LABELS and JCONIC in Japan, HYBE America with Scooter Braun Projects, HYBE Latin America in Mexico, plus HYBE CHINA and HYBE INDIA. The group also owns Weverse Company (the fan platform, launched June 2019), Supertone (AI voice — now being wound up, as we show below), HYBE IM (games), and an in-house webtoon and web-novel unit. It even holds ₩4,378 million ($3.2M) of cryptocurrency, booked as intangible assets. (Source: DART FY2025 annual report, “사업의 개요”.)
📊 Where Does HYBE’s Revenue Actually Come From?
Albums and recorded music are now 29.17% of revenue, down from 44.56% two years earlier — and the dollar amount fell, it did not merely get diluted. Concerts and merchandise did all the growing.
| Revenue line | FY2025 | FY2025 % | FY2024 % | FY2023 % | 2-yr change |
|---|---|---|---|---|---|
| Albums & music rights 음반ㆍ음원 |
$572.4M | 29.17% | 38.17% | 44.56% | −20.4% |
| Concerts (incl. fan meetings) | $565.7M | 28.83% | 19.99% | 16.49% | +112.7% |
| Merchandise & licensing | $422.5M | 21.53% | 18.63% | 14.95% | +75.3% |
| Video content & publications | $191.7M | 9.77% | 12.74% | 13.31% | −10.7% |
| Advertising & appearance fees | $109.0M | 5.55% | 5.96% | 6.51% | +3.7% |
| Fan club & other | $101.0M | 5.15% | 4.51% | 4.19% | +49.6% |
| Total | $1.96bn | 100.00% | 100.00% | 100.00% | +21.7% |
Basis: consolidated, full fiscal years ended 31 December. “2-yr change” is FY2025 vs FY2023 in won, before translation. Source: DART FY2025 annual report, “매출 및 수주상황 — 제품별 매출액”, filed 20 Mar 2026. FY2023 advertising includes management fees, per the filing’s own footnote. Label note: the filing calls the first row “음반ㆍ음원” — physical albums and recorded-music rights, streaming and distribution included. So it is not the album-unit measure in the market-share table below: the −20.4% revenue change and the −50.9% unit change are different numbers.
Read the first two rows together and the thesis of this article appears. In FY2023 HYBE sold $718.7M of albums and $265.9M of concert tickets. In FY2025 it sold $572.4M of albums and $565.7M of concert tickets — the two lines have almost converged. A company that was primarily a record label is now, in round numbers, half a record label and half a touring-and-merchandise business. The geography moved in the same direction: outward.
| Region | FY2025 | FY2025 % | FY2024 % | FY2023 % | 2-yr change |
|---|---|---|---|---|---|
| Asia 아시아 — excludes Korea |
$797.2M | 40.62% | 37.08% | 34.25% | +44.3% |
| Korea (domestic) | $535.2M | 27.28% | 33.66% | 36.19% | −8.3% |
| North America | $468.7M | 23.88% | 23.60% | 25.16% | +15.5% |
| Rest of world | $153.5M | 7.82% | 5.56% | 4.26% | +123.7% |
Basis: consolidated revenue from contracts with customers, full fiscal years. The filing’s labels are 국내, 아시아, 북미, 기타국가; reading “아시아” as Asia excluding Korea is our wording (Korea is a separate row), not the filing’s phrase. Percentages are of total revenue including a small North American sublease-rental line (0.39% in FY2025) that is omitted above, so the four rows sum to 99.61%. Source: DART FY2025 annual report, “지역별 매출액,” rcpNo 20260320000802.
Overseas revenue — everything but the 국내 row, computed by us from the filing’s amounts, not lifted from a printed total — rose from 63.67% of the total in FY2023 to 72.33% in FY2025, while domestic Korean revenue fell in absolute dollars. HYBE is becoming more of an export business, not less — the growth is in Asia ex-Korea and in the long tail of “rest of world,” where Latin America now sits.
🗓️ How Did HYBE Get Here? A Short History
Three moves built the company as it stands: the 2020 listing, the 2021 acquisition spree that bought its way into America, and the 2024 “HYBE 2.0” reorganisation that split it into music, platform and technology.
| Year | Turning point (from the filing’s own chronology) |
|---|---|
| 2005 | Founded 4 February as The Big Hit Entertainment by Bang Si-hyuk. He has been the largest shareholder continuously since — the filing states there has been no change of controlling shareholder since incorporation. |
| 2020 | KOSPI listing on 15 October. |
| 2021 | Renamed HYBE (30 March). Acquires NAVER’s V Live business into what becomes Weverse Company; invests in Supertone; announces the acquisition of US media group Ithaca Holdings (April); spins the label business out into Big Hit Music (July); absorbs the game studio Superb (November). |
| 2022 | Label build-out accelerates: LE SSERAFIM debuts (Source Music, May), NewJeans (ADOR, July), &TEAM (YX LABELS, Japan, December). |
| 2023 | BOYNEXTDOOR debuts (KOZ, May). Weverse launches its paid DM subscription (April). Enters Latin America, acquiring the Mexican label Exile Music (November). |
| 2024 | Global exclusive distribution deal with Universal Music Group (March). ILLIT (Belift Lab) and KATSEYE (HYBE×UMG) debut. “HYBE 2.0” strategy announced in August, reorganising the group into three reporting segments: Music, Platform, Tech-driven Future Growth. Lee Jae-sang becomes CEO (12 September). |
| 2025 | Absorbs subsidiary Binary (completed 3 June). aoen debuts in Japan. Weverse adds Listening Party. Album unit sales fall to a five-year low; operating profit falls 73%; the group posts a net loss. |
| 2026 | First-instance court ruling against HYBE in the ADOR shareholder-agreement case (12 February); ₩29,250 million court deposit lodged (25 February). The founder donates 546,120 shares to the company for employee pay (resolved 12 February, transferred 31 March) and 192,126 more in May. Value-Up plan filed (23 April). Half-year revenue up 78.1%, with a reported operating loss of $19.0M — or an adjusted profit of $169.9M on HYBE’s own basis, once that gift’s ₩255.0bn Q1 cost is added back. |
Source: DART FY2025 annual report, “2. 회사의 연혁” and “아. 그 밖에 경영활동과 관련된 중요한 사실의 발생,” rcpNo 20260320000802; H1 2026 half-year report, rcpNo 20260814004127, filed 14 Aug 2026.
🌍 Is HYBE Actually a Global Leader in Anything?
Yes — HYBE’s artists accounted for 30.3% of Korea’s top-100 album sales in 2025, the largest share of any company. But that is down from 42.3% in 2023, and the underlying unit volume has halved.
This is the one market-share figure HYBE publishes, and the filing prints both the numerator and the denominator — which lets us see something the percentage hides.
| Year | HYBE artists’ album units | Korea top-100 album units | HYBE share |
|---|---|---|---|
| 2020 | 12,839,329 | 34,913,554 | 36.8% |
| 2021 | 15,231,390 | 45,468,887 | 33.5% |
| 2022 | 19,694,779 | 60,476,914 | 32.6% |
| 2023 | 39,836,602 | 94,167,827 | 42.3% |
| 2024 | 28,307,787 | 71,198,127 | 39.8% |
| 2025 | 19,555,367 | 64,615,322 | 30.3% |
Company-reported, sourced by HYBE to Circle Chart’s top-100 album ranking. We reproduced each share from the filing’s own numerator and denominator and they agree to the printed rounding (e.g. 19,555,367 ÷ 64,615,322 = 30.26%). This is a Korean-market album-unit measure only — it is not global market share, not streaming, and not revenue. Source: DART FY2025 annual report, “(5) 시장점유율,” rcpNo 20260320000802.
Two things happened at once between 2023 and 2025. Korea’s top-100 album market contracted 31.4%, from 94.2 million units to 64.6 million — and HYBE’s own units fell 50.9%, from 39.8 million to 19.6 million. HYBE fell faster than the market it leads, which is why its share dropped 12 percentage points. The physical-album boom that powered K-pop’s 2021–2023 earnings has deflated, and HYBE was most exposed because it was the biggest beneficiary.
That table explains the revenue-mix table above. HYBE did not choose to become a touring company. Its album business shrank, and touring grew into the gap.
📈 Is the Business Getting Better or Worse?
Revenue is growing fast and reported profitability is not: HYBE grew sales 17.5% in FY2025 and 78.1% in the first half of 2026, while operating profit fell 73% and then went negative — though the H1 2026 loss reverses to a $169.9M profit on HYBE’s own adjusted basis, so the two periods are not one story.
| Consolidated, full year | FY2025 | FY2024 | FY2023 |
|---|---|---|---|
| Revenue | $1.96bn | $1.67bn | $1.61bn |
| Gross profit | $693.0M | $710.8M | $747.2M |
| Gross margin | 35.3% | 42.6% | 46.3% |
| Operating profit | $36.5M | $136.3M | $218.9M |
| Operating margin | 1.9% | 8.2% | 13.6% |
| Other expenses (non-operating) | $218.5M | $97.1M | $123.4M |
| Pre-tax profit / (loss) | ($131.3M) | $14.4M | $185.2M |
| Income tax expense | $57.0M | $16.9M | $49.4M |
| Net profit / (loss), total | ($188.4M) | ($2.5M) | $135.9M |
| — attributable to owners of the parent | ($175.7M) | $6.9M | $138.7M |
| — attributable to minorities | ($12.7M) | ($9.5M) | ($2.8M) |
Basis: consolidated (IFRS), 12-month fiscal years ended 31 December — not separate-entity accounts and not quarterly. Note the two net-income rows: they differ by the minority share, and press coverage quotes both interchangeably. Source: DART FY2025 annual report, consolidated statement of comprehensive income, rcpNo 20260320000802.
Look at the gross-profit row. Revenue rose 21.7% between FY2023 and FY2025 and gross profit fell — from $747.2M to $693.0M. Cost of sales grew 46.6% while revenue grew 21.7%. That is what a mix shift from albums to concerts and merchandise looks like in the accounts: a bigger top line carrying a materially thinner spread.
The 2026 half-year is stranger still, and this is where units and bases matter most.
| Consolidated | Q2 2026 3 months |
H1 2026 6 months cumulative |
H1 2025 6 months cumulative |
|---|---|---|---|
| Revenue | $1.07bn | $1.59bn | $893.3M |
| Gross profit | $341.7M | $562.9M | $372.1M |
| Gross margin | 31.8% | 35.4% | 41.7% |
| Operating profit / (loss) | $126.6M | ($19.0M) | $64.8M |
| Pre-tax profit | $121.9M | $23.7M | $82.6M |
| Income tax expense | $40.7M | $58.5M | $30.9M |
| Net profit / (loss), total | $81.3M | ($34.7M) | $51.7M |
Basis: consolidated. The Q2 column is the filing’s three-month column; the H1 columns are the filing’s six-month cumulative columns. These are different bases and must not be compared to each other directly. Q2 gross margin is computed on the three-month column. Source: DART H1 2026 half-year report, rcpNo 20260814004127, filed 14 Aug 2026.
Half-year revenue of $1.59bn is 81% of HYBE’s entire FY2025 revenue, earned in six months — a 78.1% jump on H1 2025. Q2 alone was strongly profitable, at an 11.8% operating margin. Yet the six-month cumulative operating line is a loss of $19.0M, because the first quarter carried a large operating loss: deriving Q1 as the cumulative figure minus the three-month figure gives revenue of $517.2M against SG&A of $366.8M — an SG&A-to-revenue ratio of 70.9%, versus 20.0% in Q2.
What Was That First-Quarter Cost? HYBE Names It Itself
₩255.0bn ($188.8M) of it was the accounting cost of shares HYBE’s founder gave to the company to pay employees — a charge with no cash leaving the business, and HYBE published an adjusted operating profit that strips it out. It is the same event as the treasury-share story in the governance section below.
The source is not the half-year report. It is the one-page fair-disclosure filing HYBE lodged with its Q2 results on 28 July 2026, which prints an adjusted cumulative operating profit of ₩229.4bn beside the reported −₩25.7bn, and then explains the gap in a footnote. Translated from the filing:
“The adjusted operating profit (cumulative) above is the Company’s consolidated operating profit excluding approximately ₩255.0bn of cost related to the employee share gift that arose in the first quarter. During the first quarter the Company’s largest shareholder donated shares of the Company that he held to the Company for the purpose of employee compensation, and the Company used those shares as the resource for compensation across all employees. Because the cost above is a one-off accounting cost involving no outflow of assets, we disclose adjusted operating profit (cumulative) in order to prevent distortion of operating results and to present the underlying performance of the business.”
The arithmetic closes on the company’s own numbers.
| Consolidated, six months to 30 Jun 2026 | As reported | HYBE’s adjusted figure |
|---|---|---|
| Operating profit / (loss) | ($19.0M) −₩25.7bn |
$169.9M ₩229.4bn |
| Excluded: Q1 employee share-gift cost | not excluded | $188.8M ₩255.0bn |
| Q1 SG&A as % of Q1 revenue | 70.9% | 34.4% |
Basis: consolidated, six-month cumulative. Reported operating loss and the adjusted figure are both printed in the same filing; the excluded cost is the “approximately ₩255.0bn” the filing names. −$19.0M + $188.8M = $169.8M, against the adjusted ₩229.4bn = $169.9M — the rounding gap is the filing’s own “approximately.” The adjusted Q1 SG&A ratio is our calculation, not HYBE’s: ($366.8M − $188.8M) ÷ $517.2M. HYBE is not audited on the adjusted figure and labels the Q2 numbers as unreviewed. Source: DART, “Operating results on a consolidated basis (provisional) — fair disclosure,” rcpNo 20260728800448, filed 28 Jul 2026.
The honest reading of the first half needs both sentences. Reported: revenue up 78.1% with a $19.0M operating loss. Adjusted, on HYBE’s own disclosed basis: revenue up 78.1% with a $169.9M operating profit, the loss having been manufactured by a non-cash charge the founder funded personally. A reader given only the first sentence concludes the business deteriorated. In the first half of 2026 it did not, and not for that reason.
Quick take — and one thing we will not claim. HYBE disclosed the gifts separately: 546,120 shares on 31 March 2026 at a disclosed ₩209.2bn, and 192,126 shares on 20 May at ₩45.2bn — cumulatively ₩254.3bn, each valued at the close the day before its board resolution (Source: DART rcpNo 20260429000828, rcpNo 20260521000530). That total sits within 0.3% of the ₩255.0bn expense — but the second tranche came in the second quarter, and an IFRS share-based-payment charge is not measured the way a fair-trade-law filing measures a gift. So we print both and equate neither. What is certain is which tranche made the Q1 charge: the February one, for 546,120 shares — 2.84× the May tranche.
🔍 Why Did Revenue Rise 17.5% While Operating Profit Fell 73%?
Two reasons, and the segment note names both: the music business halved its own margin, and the technology division lost more money than it earned in revenue.
The headline numbers are not our arithmetic. HYBE filed a “change in revenue or profit structure of 15% or more” disclosure on 12 February 2026 printing revenue +17.5% and operating profit −72.9%, consolidated, with its own one-line causes: revenue up on touring and merchandise, operating profit down on “investment to expand the global IP portfolio and costs to improve the operating efficiency of the US business structure.” Those are management’s attributions; this section tests them against the segment note. Basis: that filing is pre-audit, so −72.9% is provisional (audited operating profit came in at ₩49.3bn against the ₩49.9bn filed). (Source: DART rcpNo 20260212801167.)
HYBE reports three segments, introduced with the “HYBE 2.0” reorganisation in August 2024. The segment note is the most useful page in the filing and it has no English equivalent.
| Segment | FY2025 revenue external |
Share of group | FY2025 operating result | FY2025 margin | FY2024 operating result |
|---|---|---|---|---|---|
| Music (labels, albums, tours, merch) | $1.70bn | 86.4% | $115.2M | 6.8% | $216.4M |
| Platform (Weverse) | $217.5M | 11.1% | $4.0M | 1.8% | ($10.2M) |
| Tech-driven Future Growth (Supertone, games) | $49.6M | 2.5% | ($60.2M) | −121.3% | ($41.7M) |
| Sum of the three segments | $1.96bn | 100.0% | $59.0M | 3.0% | $164.4M |
| Consolidation adjustments | — | — | ($22.5M) | — | ($28.1M) |
| Group operating profit | $1.96bn | — | $36.5M | 1.9% | $136.3M |
Basis: consolidated, full fiscal years. Revenue shown is external (revenue from contracts with customers, after eliminating inter-segment sales of $648.6M in FY2025); segment operating results are as reported, before the consolidation adjustment line. Margins are computed on external revenue. Source: DART FY2025 annual report, Note 34 “영업부문 정보,” rcpNo 20260320000802.
The Music segment did what the revenue-mix table predicted: external revenue up 17.7%, operating margin down from 15.0% to 6.8%, operating profit nearly halved. That is the album-to-tour swap arriving at the profit line.
The Tech segment is the part no one outside Korea seems to quote. It earned $49.6M of external revenue and posted a $60.2M operating loss — an operating margin of minus 121%. It loses more than it sells. Over FY2024 and FY2025 combined it lost $101.9M. And it is the reason the headline number looks as bad as it does: the Tech loss is 1.65× the entire group’s operating profit. Strip that segment out and group operating profit for FY2025 would have been roughly $96.7M rather than $36.5M — still down on FY2024, but not a 73% collapse.
The good news in the same table is Weverse. The Platform segment turned its first operating profit — from a $10.2M loss to a $4.0M profit on $217.5M of revenue. It is a 1.8% margin, so it is a business that has just crossed break-even rather than a profit engine. But the direction is right, and it is the only segment whose direction is.
🔬 What Did HYBE Write Off — and What Do Its Own Forecasts Assume?
HYBE recognised $198.9M of impairments in FY2025 — 5.45 times its operating profit — and its own impairment model assumes its AI-voice subsidiary will grow revenue 62.5% a year for five years and still run a negative 34.7% operating margin.
HYBE’s FY2025 “other expenses” line is $218.5M — six times its operating profit. The note that breaks it down shows it is almost entirely write-downs:
| FY2025 impairment charge | Amount | × operating profit |
|---|---|---|
| Intangible assets — of which: | $121.2M | 3.32× |
| — goodwill | $74.5M | 2.04× |
| — other intangibles | $46.7M | 1.28× |
| Investments in associates & joint ventures | $61.0M | 1.67× |
| Property, plant & equipment | $16.6M | 0.46× |
| Total impairments | $198.9M | 5.45× |
Basis: consolidated, FY2025. “× operating profit” divides each charge by FY2025 group operating profit of $36.5M. The three component rows add to $198.8M against the $198.9M total shown: the total is the filing’s unrounded sum, the components are rounded individually. The goodwill / other-intangibles split is our derivation from two notes read together — the filing gives the $121.2M intangibles charge in one note and the $74.5M goodwill portion in another; $46.7M is the residual. Source: DART FY2025 annual report, Note 25 “기타수익 및 기타비용” and Note 12 “무형자산,” rcpNo 20260320000802.
HYBE’s balance sheet is unusually intangible. Goodwill of $1.24bn equals 47.3% of total equity and 24.8% of the market capitalisation; total intangibles of $1.47bn are 55.9% of equity and 36.2% of assets. At that weighting the annual impairment test is not a footnote but a material earnings input — and the filing discloses exactly where the goodwill sits.
| Cash-generating unit | Goodwill carried | % of goodwill | FY2025 impairment |
|---|---|---|---|
| Ithaca Holdings LLC (US) | $609.8M | 49.03% | ($15.6M) |
| Belift Lab | $160.4M | 12.90% | — |
| QC Media Holdings LLC (US) | $151.5M | 12.18% | ($20.5M) |
| V Live business unit (now Weverse) | $143.6M | 11.55% | — |
| Pledis Entertainment | $103.5M | 8.32% | — |
| Ithaca Concierge Service (US) | $27.9M | 2.24% | — |
| Zarpazo & AJA Podcasts (US) | $21.2M | 1.71% | — |
| Supertone | $12.2M | 0.98% | ($38.4M) |
| Source Music | $5.3M | 0.42% | — |
| KOZ Entertainment | $4.8M | 0.38% | — |
| ADOR | $3.6M | 0.29% | — |
| Total | $1.24bn | 100.00% | ($74.5M) |
Basis: consolidated, carrying amounts at 31 December 2025. The eleven CGU rows sum exactly to the reported goodwill balance of ₩1,679,490,429 thousand (we checked). Impairment amounts are the three charges the filing itself lists; a dash means no impairment was recognised on that CGU in FY2025 — carrying-value movements on the US units also include foreign-exchange translation, which is not impairment. Source: DART FY2025 annual report, goodwill note, “현금창출단위별로 배부된 주요 영업권의 상세 내역,” rcpNo 20260320000802.
Two observations. First, 65.2% of HYBE’s goodwill is American — Ithaca Holdings, QC Media, Ithaca Concierge and the Zarpazo/AJA podcast assets, with Ithaca alone 49% of the total at $609.8M. To a first approximation HYBE’s balance sheet is a Korean label group carrying a large US media acquisition at cost.
Second, the Supertone row. HYBE wrote off $38.4M against a remaining carrying value of $12.2M — eliminating 75.8% of that unit’s goodwill in one year. Supertone is a Korean company, so this is not currency translation. It is a judgment that the business is worth far less than HYBE paid.
And here is the part that exists only in the Korean filing. Impairment tests require companies to publish the assumptions behind them. HYBE’s table reads:
| Cash-generating unit | Assumed revenue growth 5-yr average |
Assumed operating margin | Discount rate |
|---|---|---|---|
| Supertone | 62.53% | −34.66% | 14.73% |
| Zarpazo & AJA Podcasts | 95.22% | 6.39% | 12.60% |
| ADOR | 36.89% | 12.93% | 12.23% |
| QC Media Holdings | 27.67% | 26.60% | 12.10% |
| Ithaca Holdings | 26.37% | 14.48% | 9.20–11.70% |
| V Live business unit | 22.34% | 9.24% | 9.74% |
| KOZ Entertainment | 21.10% | 18.33% | 12.36% |
| Source Music | 16.23% | 11.02% | 12.21% |
| Belift Lab | 14.67% | 23.86% | 12.18% |
| Pledis Entertainment | 9.49% | 12.74% | 10.62% |
| Ithaca Concierge Service | 3.36% | 17.61% | 10.10% |
These are management’s own assumptions in the FY2025 goodwill impairment test, not our estimates and not forecasts of reported results. Revenue growth is the compound average over the five-year projection period; operating margin is the average margin assumed over that period; terminal growth is 1.00% for every unit except Ithaca (2.50%) and QC Media (2.00%). Source: DART FY2025 annual report, goodwill impairment note, rcpNo 20260320000802.
Read the Supertone row slowly. HYBE’s valuation model for its own AI-voice business assumes revenue compounding at 62.53% a year — the most aggressive growth assumption in the table — and an average operating margin of minus 34.66%, the only negative margin assumption HYBE makes about any of its businesses. The company’s own base case is that Supertone grows very fast and still loses money throughout the forecast period. And even on that base case the model could not support the carrying value, so three quarters of the goodwill went.
That is more informative about HYBE’s technology strategy than any announcement of it, and it reframes the Tech segment’s $60.2M operating loss: the loss is not an overshoot against plan. It is the plan.
And there is a postscript that closes the loop, which we found in the next filing rather than the news. HYBE’s half-year report for 2026 lists its consolidated subsidiaries, and against Supertone (56.6%-owned) it carries footnote 9: “당기 중 청산예정입니다” — scheduled for liquidation during the period. The same filing’s schedule of board resolutions records that at meeting number 8 on 30 June 2026, the board passed an item reading simply “Approval of dissolution of a subsidiary,” with one director absent and the rest in favour. The middle link is inference, and we flag it: the board item does not name the company, and footnote 9 is attached to two subsidiaries — Supertone and Binary Singapore Pte. Ltd. What the filings establish is that the board resolved to dissolve an unnamed subsidiary, two subsidiaries carry the liquidation footnote, and Supertone is the one written down 75.8% three months earlier. We think the resolution is Supertone’s; the filing does not say so. (Source: DART H1 2026 half-year report, rcpNo 20260814004127, subsidiary schedule footnote 9 and board-resolution table.)
So the sequence, entirely from HYBE’s own filings, runs: write the unit down 75.8% on a model that assumes it never earns a profit (March 2026) → resolve to dissolve it (June 2026) → disclose it as pending liquidation (August 2026). HYBE issued no standalone material-event disclosure for it: across all 168 HYBE filings DART received between 1 January 2025 and 28 September 2026, none concerns a dissolution or liquidation — while other subsidiary-level material-event filings do appear in that window, so the search works. Why the company judged one unnecessary we cannot say: Korea’s subsidiary thresholds run on the subsidiary’s share of assets and revenue, which HYBE does not disclose for Supertone. The event exists only in a footnote and a board-minute table.
Quick take. When a company assumes a negative margin in its own discounted-cash-flow test, it is telling you the unit is a call option rather than a business — and in this case it closed the option six months later. Sizing matters, though: Supertone was only 0.98% of goodwill, so the balance-sheet risk there is now spent. The $1.24bn question is Ithaca and QC Media, which together carry $761.3M and were written down by $36.1M this year on assumptions of 26–28% annual revenue growth.
🧾 How Can HYBE Report a Pre-Tax Profit and Still Post a Net Loss?
Because its expected annual consolidated effective tax rate is 246.28% — a figure HYBE discloses in its own half-year filing, and one we can reproduce from its income statement.
In the first half of 2026 HYBE earned a pre-tax profit of $23.7M, booked a tax charge of $58.5M, and reported a net loss of $34.7M. Dividing the charge by pre-tax profit gives 246.28% — and the half-year report states the same number in words, in the note headed “18. Income tax expense (consolidated)”: the expected weighted-average annual effective tax rate for the year ending 31 December 2026 is 246.28% (prior half-year: 37.37%). It is an expected annual rate on the consolidated accounts, not a realised rate and not the separate-entity figure. This is not a one-quarter distortion; it is the rate the company expects for the full year. FY2024’s rate, on the same disclosure basis, was 117.7% — HYBE paid more tax than it earned pre-tax. For FY2025 the filing prints a dash, because the denominator is a loss.
The reason is in the FY2025 tax reconciliation, and it is a single line.
| FY2025 tax reconciliation | Amount |
|---|---|
| Pre-tax loss | ($131.3M) |
| Tax at the statutory computation | ($55.5M) |
| Change in unrecognised deferred tax | +$124.0M |
| Foreign tax paid directly | +$22.1M |
| Back taxes assessed | +$10.9M |
| Non-taxable income | ($22.0M) |
| Credits and exemptions | ($13.0M) |
| Other, incl. consolidated-filing effect | ($9.5M) |
| Tax expense recognised | $57.0M |
Basis: consolidated, FY2025. The “statutory computation” line is as printed by the filing; it is not consolidated pre-tax loss multiplied by a single headline rate, so we do not derive an implied rate from it. “Other” aggregates two small lines for readability. Source: DART FY2025 annual report, income tax note, rcpNo 20260320000802.
The line that matters is “change in unrecognised deferred tax,” $124.0M. Under IFRS a company books a deferred tax asset on its losses only if it expects future profits to use them against. HYBE declined to recognise $124.0M of such assets — a management judgment, disclosed in a table, that a large block of its losses will probably never be usable.
Why? Because of the structure described at the top of this article. Fifteen labels and dozens of subsidiaries across six countries cannot generally offset each other’s losses for tax purposes. The profitable units pay tax in their own jurisdictions — the $22.1M of “foreign tax paid directly” is that bill — while the lossmaking units accumulate relief that sits unused. A consolidated group can report a modest pre-tax profit and still owe substantial cash tax, because tax authorities do not see the consolidation.
The practical consequence: HYBE’s reported net income is currently a poor guide to its economics in either direction. The tax line is doing more work than the operating line.
💰 What Do You Actually Pay for HYBE Today?
₩156,800 ($116) a share, for a $5.01bn company with no meaningful earnings, at 2.08× the book value attributable to its own shareholders — and the thinnest operating margin of any listed Korean entertainment peer in our comparison set.
| HYBE valuation snapshot | As of 23 Sep 2026 |
|---|---|
| Share price | ₩156,800 ($116) |
| Market capitalisation | $5.01bn |
| Shares outstanding | 43,106,836 |
| Price / earnings | not meaningful (FY2025 loss) |
| Price / book, owners’ equity | 2.08× |
| Price / book, total equity incl. minorities | 1.90× |
| Dividend per share (FY2025) | ₩500 — a 0.32% yield |
| Year to date (from ₩330,000, 30 Dec 2025) | −52.5% |
| 52-week high intraday, 13 Feb 2026 | ₩405,500 |
| 52-week low intraday, 23 Sep 2026 | ₩153,900 |
| Drawdown from the 52-week high | −61.3% |
| Goodwill as % of market cap | 24.8% |
Price, share count and market capitalisation are the settled KRX close of 23 September 2026 (43,106,836 × ₩156,800 = ₩6,759,151,884,800; we reconciled the three to each other). Book values are from the FY2025 consolidated balance sheet — owners’ equity ₩3,257,026,727 thousand, total equity ₩3,551,456,465 thousand — so the two P/B figures differ only in whether minority interests are included. These are point-in-time figures and go stale quickly. Sources: Korea Exchange for price and shares; DART FY2025 annual report for book value and dividend.
Against its listed Korean peers, HYBE is by far the largest and by some distance the least profitable. One precision: the margin column is operating margin, where all five peers are positive and HYBE is barely so at 1.9%. HYBE is the only one of the six with a FY2025 net loss we have verified — we could not verify net income for YG or Dear U (see the P/E footnote), so we do not claim the other five were all net-profitable.
| Company | Market cap | FY2025 revenue | FY2025 operating margin | P/B | YTD |
|---|---|---|---|---|---|
| HYBE (352820) | $5.01bn | $1.96bn | 1.9% | 1.90× | −52.5% |
| SM Entertainment (041510) | $1.40bn | $870.1M | 15.6% | 1.39× | −38.8% |
| JYP Entertainment (035900) | $992.0M | $608.6M | 18.9% | 2.14× | −48.1% |
| YG Entertainment (122870) | $596.6M | $403.9M | 13.1% | 1.24× | −37.9% |
| Studio Dragon (253450) | $453.0M | $393.0M | 5.7% | 0.76× | −52.4% |
| Dear U (376300) | $299.6M | $62.1M | 37.4% | 1.93× | −57.5% |
All prices and market caps are settled closes of 23 September 2026 from the Korea Exchange; all financials are FY2025 consolidated from DART. P/B is market cap ÷ total equity (including minority interests) for all six rows, so the column is internally comparable — note this is the 1.90× figure for HYBE, not the 2.08× owners’-equity figure above. Operating margin is operating income ÷ revenue, computed by us from the two reported figures. On P/E we publish a hole rather than a number: SM trades at 5.4×, JYP at 8.3× and Studio Dragon at 59.3× FY2025 controlling-interest earnings; HYBE has no meaningful P/E because it lost money; and we have excluded YG and Dear U because our own data pipeline’s earnings denominator for those two failed a basis check (it used group earnings including minorities for YG, and a prior-year figure for Dear U). Rather than print two numbers on a different basis from the rest of the column, we leave them out and say why.
What is HYBE-specific is the margin column. HYBE earns a 1.9% operating margin where JYP earns 18.9% and Dear U earns 37.4%. HYBE is nearly 3.2× JYP’s revenue and earns less operating profit in absolute dollars. That is the multi-label, multi-segment structure at work: scale has not produced operating leverage.
Is this a sector selloff or a HYBE problem? It depends entirely on the window.
The YTD column above invites an obvious reading — all five peers are down 37.9% to 57.5%, so this is a sector de-rating and HYBE is mid-pack. Over a shorter window that reading collapses. We show both, because they disagree.
| Price return to 22 Sep 2026 | 5 sessions | 20 sessions | 60 sessions | YTD 2026 |
|---|---|---|---|---|
| HYBE | −9.71% | −9.23% | −12.09% | −52.64% |
| SM Entertainment | −6.74% | +13.18% | +22.71% | −38.8% |
| JYP Entertainment | −4.21% | −4.70% | −21.71% | −48.1% |
| YG Entertainment | −4.71% | +8.14% | +8.70% | −37.9% |
| KOSPI index | +5.89% | +4.08% | −16.56% | +66.53% |
Price returns only, no dividend adjustment, computed from settled KRX closes over trading sessions ending 22 September 2026. YTD is based on 30 December 2025, the last 2025 trading session (31 December was closed). KOSPI from the Korea Exchange daily index series. Peer YTD figures are from our stock fact sheets on a 23 September cut and are shown to one decimal; HYBE’s is computed to the 22 September cut for window consistency with the other three columns. Sources: Korea Exchange daily settled prices and index levels.
The windows disagree, and the disagreement is the story. Over 60 sessions SM was up 22.71% and YG up 8.70% while HYBE fell 12.09%. Over 20 sessions the same two were up double digits and single digits respectively while HYBE fell again. HYBE is the worst performer of the four in all three short windows. So “K-pop sector selloff” is not supported by the price data — it is supported only by the year-to-date column, which is long enough to contain a different regime.
The single most arresting figure in the table is not about the sector at all. The KOSPI is up 66.53% in 2026 and HYBE is down 52.64% — a 119-percentage-point spread. Whatever is happening to this share price, it is not market beta. Over the 60-session window HYBE actually outperformed a falling index by 4.47 points; the entire underperformance is concentrated in the last twenty sessions, while the index was recovering.
🏷️ Which HYBE Ticker Are You Actually Buying?
Only one security exists: ordinary shares of HYBE Co., Ltd., code 352820 on the Korea Exchange, ISIN KR7352820005. There is no HYBE ADR and no US quotation — and the ticker “HYBE” on the US over-the-counter market belongs to an entirely different company.
⚠️ If you type HYBE into a US brokerage account, you will not get the BTS company.
OTC: HYBE is Hybrid Energy Holdings, Inc. — an unrelated US shell company quoted at a fraction of a cent, with no connection of any kind to the Korean entertainment company. Three quote services we checked directly — TradingView, CNBC and stockanalysis.com — resolve the symbol to that shell rather than to HYBE. (Verified 28 September 2026; company identity per OTC Markets.)
And “Nasdaq: KWM” no longer exists — typing it into a broker returns nothing. K Wave Media Ltd. renamed itself Nexus Advanced Technologies Inc. in September 2026 and now trades as NXAT, on the Nasdaq Capital Market (symbol-directory category S) rather than the Global Market. Its link to HYBE is a contract, not a shareholding: on 3 April 2026 its subsidiary Play Company entered a Supply and Distribution Agreement under which HYBE granted it “a worldwide priority right to purchase and distribute video publications and printed materials produced by HYBE … relating to certain concerts of musical groups BTS, Seventeen, Tomorrow X Together and LE SSERAFIM” — one year in term, at Play Company’s own cost and risk. The 20-F carries no ownership disclosure anywhere, so buying NXAT gives you no exposure to HYBE’s earnings. (Sources: Nasdaq symbol directory generated 28 September 2026 — lists NXAT and NXATW, contains no KWM, control symbol AAPL present; SEC EDGAR CIK 0002000756, which carries “K Wave Media Ltd.” only as a former name, with filings from 11 September 2026 onward under the new one; SEC Form 20-F, filed 15 May 2026, “HYBE Supply and Distribution Agreement”.)
The absence of an ADR is documented, not assumed. HYBE does not appear in the Nasdaq/NYSE/NYSE American symbol master under HYBE, HYBEY or HYBBF, and it does not appear in the commercial securities databases that do carry Korean unsponsored OTC receipts such as Samsung Electronics (SSNLF) and Hyundai Motor (HYMTF) — our positive controls, which those databases return by both company name and ticker, so the lookup works. SEC EDGAR shows no Form F-6 registration of depositary shares and no Form 25 delisting notice, so none was ever created and none was withdrawn. HYBE has filed with the SEC exactly once in its history: a Form D on 28 May 2021, claiming a Rule 506(b) exemption for $32,747,241 of equity, first sale 12 April 2021 — a notice of an exempt private placement, the legal opposite of a public offering. Read the form’s own fields and it is narrower still: isBusinessCombinationTransaction is true and grossProceedsUsed is 0, so the equity was issued as consideration in a business combination rather than sold for cash — consistent in timing with the Ithaca Holdings acquisition. One limitation we will state plainly: a true grey-market receipt traded broker-to-broker would not appear in any database we queried. (Source: SEC EDGAR, CIK 0001864515.)
| Name you may encounter | What it is |
|---|---|
| HYBE Co., Ltd. — Korea Exchange code 352820 | The listed operating and holding company. This is the only HYBE equity on a public exchange. |
| Big Hit Entertainment | The same company, renamed HYBE on 30 March 2021. Pre-2021 filings, IPO documents and news archives use this name. No separate ticker exists. |
| Big Hit Music | A wholly owned label subsidiary spun out of the parent on 1 July 2021 — BTS’s label. Not listed; not the same entity as the listed company. |
| OTC: HYBE | A different company. Hybrid Energy Holdings, Inc., an unrelated US shell quoted at a fraction of a cent. |
| Nasdaq: NXAT (formerly KWM) | Not HYBE. Nexus Advanced Technologies Inc., renamed from K Wave Media Ltd. in September 2026; a separate Nasdaq Capital Market company whose subsidiary holds a one-year distribution contract with HYBE. A counterparty, not an owner. “KWM” is a dead ticker — typing it into a broker returns nothing. |
| NSE: ADOR · LON: ITH | Name collisions only. Ador Welding Limited (India) is unrelated to HYBE’s ADOR label; Ithaca Energy plc (North Sea oil and gas) is unrelated to Ithaca Holdings. |
| Weverse Company | The Platform segment. A consolidated subsidiary with an outside investment from NAVER carrying put-and-call arrangements. Not listed. |
| ADOR, Pledis, Source Music, Belift Lab, KOZ, Supertone, HYBE IM | Consolidated subsidiaries, several with minority shareholders. None separately listed. |
| Ithaca Holdings, QC Media | US-domiciled acquired businesses inside the consolidation. Not separately listed. |
Source: DART FY2025 annual report — consolidated subsidiary schedule, corporate history and merger/spin-off disclosures, rcpNo 20260320000802. Holding-structure and put-option detail from the same filing’s derivatives and put-back-option note.
The practical consequence: buying HYBE means buying the Korean share. It is a KOSPI 200 constituent, so index products carry it, but there is no US-traded single-name alternative. See our guide to how to buy Korean stocks as a foreign investor for the routes in, and for the mechanics of quoting Korean prices in dollars, our note on Korean share prices in USD.
Our own list of Korean stocks available as US-listed ADRs covers the ten names on the NYSE and Nasdaq, and HYBE is not among them — but absence from that list is not by itself the whole claim, because Samsung Electronics and Hyundai Motor are also missing from it and both trade as unsponsored OTC receipts. HYBE’s case is the stronger one: it is absent from the exchange list and has no receipt anywhere in the OTC universe, where the symbol “HYBE” belongs to somebody else entirely.
🌏 Is Foreign Money Buying or Selling HYBE?
Selling — in every window we measured — but almost all of it happened in five sessions, and foreigners were net buyers in the fifteen sessions immediately before that.
| Window to 22 Sep 2026 | Foreign | Institutions | Retail |
|---|---|---|---|
| 5 sessions 16–22 Sep | −$35.6M −299,037 sh |
−$19.0M −159,937 sh |
+$54.2M +455,483 sh |
| 20 sessions 26 Aug–22 Sep | −$28.4M −244,092 sh |
−$20.0M −172,441 sh |
+$49.1M +421,464 sh |
| 60 sessions 29 Jun–22 Sep | −$39.6M −270,642 sh |
see note −91,187 sh / +$21.0M |
+$17.5M +354,816 sh |
Method: flows are reported by the exchange as share counts, so any currency figure is derived. We multiply each session’s net shares by that session’s settled close and sum — an approximation, not execution prices — then translate at ₩1,350.36/$1. Windows are trading sessions and were verified gap-free (67 flow rows against 67 price sessions, no missing dates). Source: Korea Exchange investor-type data via our own daily collection.
⚠️ Two things in that table contradict the obvious reading. We are printing both rather than picking the tidier one.
1. The institutional 60-session cell has opposite signs in shares and dollars. Institutions sold a net 91,187 shares and yet were net buyers of $21.0M. That is not an error — it means they bought at high prices and sold at low ones. Decomposed: they bought +81,254 shares (+$41.0M) in the 40 sessions to 25 August, when HYBE was in the ₩170,000–232,000 range, then sold 172,441 shares into the September decline. We therefore do not quote an average price or a single “institutional flow” figure for this window — the ratio of the two numbers is meaningless, and any single figure would smuggle in a direction the data does not support.
2. “Foreigners have been selling HYBE for months” is false. The 5-session outflow (−299,037 shares) is larger than the 20- and 60-session outflows, which is only arithmetically possible if the middle of those windows was positive. It was. Over the fifteen sessions from 26 August 2026 to 15 September 2026, foreign investors were net buyers of HYBE (352820): +54,945 shares, worth +$7.2M on the same house method. And a single session, 22 September, was −152,130 shares (−$17.6M) — 50.9% of the entire five-day total. So what the table shows is a reversal compressed into one week, and arguably into one day. It is not accumulation and it is not a months-long exit; describing it as either would be reading a five-session event as a trend.
3. One limit on all three windows. Our HYBE flow series holds 68 sessions, 18 June to 23 September 2026 — enough for every window above, and nothing at all about the first half of the year. Where we call a session the heaviest, we mean the heaviest in that window, never “of the year.”
Is this HYBE-specific or sector-wide? On raw dollars it looks HYBE-specific, because HYBE is the biggest name. Normalise by market capitalisation and the ranking inverts:
| Foreign net selling, % of market cap | 5 sessions | 10 sessions | 20 sessions | 60 sessions |
|---|---|---|---|---|
| HYBE | 0.714% most sold of all six | 0.693% | 0.570% | 0.793% |
| SM Entertainment | 0.565% | 0.855% | 1.403% | 1.927% |
| JYP Entertainment | 0.534% | 1.125% | 1.447% | 4.015% |
| YG Entertainment | 0.634% | 1.083% | 1.597% | 2.846% |
| Studio Dragon | 0.167% least sold of all six | 0.109% least | 0.060% least | 0.766% least |
| Dear U | 0.367% | 0.289% | 0.163% | 3.452% |
Foreign net selling valued by the house method above, divided by each company’s settled market capitalisation at 22 September 2026. Foreign flow was negative in all twenty-four cells — six companies × four windows, no exceptions — so the direction is genuinely sector-wide; only the intensity differs. Basket matters, so we print both. Among the four listed label groups (HYBE, SM, JYP, YG) HYBE is the least sold over 10, 20 and 60 sessions and the most sold over 5; widen to six by adding Studio Dragon (drama) and Dear U (fan messaging) and “least sold” moves to Studio Dragon in every window. Windows are trading sessions ending 22 September 2026; our HYBE flow series begins 18 June 2026, so 60 sessions is the longest we can run. Source: Korea Exchange investor-type data via our own daily collection.
The honest version is the combination, with the basket named: foreigners were net sellers of all six listed Korean entertainment names in all four windows we checked; among the four label groups HYBE was the least sold relative to its size over 10, 20 and 60 sessions and then became the most sold over the final five — and across all six names that “least sold” distinction belongs to Studio Dragon, not HYBE. The reversal survives the widening: on five sessions HYBE is the most sold of all six. That is what makes it a one-week event rather than a quarter-long exit. We make no claim that the flow caused the price move; over these same windows SM and YG rose while foreigners sold them too. For the weekly market-wide version, see our Foreign Flow Watch series and our primer on how foreign and institutional flows move Korean stocks.
What the filings do not explain
Because the most important events at an entertainment company are often decided outside it — by artists, courts and fans — we screened every 2026 session for a close-to-close move of 5% or more. Twenty-one sessions qualified — and the single largest move of the year brackets a disclosure, rather than avoiding one:
- 28 July −16.09%, then 29 July −9.80% — a 24.3% fall over two sessions, the largest event of HYBE’s year, and it lands on the results. HYBE filed its Q2 fair disclosure that same day, 28 July, at a stated 3:00 p.m. — thirty minutes before the KRX close — with a conference call to follow. That filing carried the six-month operating loss of ₩25.7bn ($19.0M) against a ₩87.5bn ($64.8M) profit a year earlier. We claim no causation; we record that the year’s biggest two-session drawdown is dated to the hour of a results release, which is the opposite of a disclosure vacuum. (Source: DART rcpNo 20260728800448.)
- The institutions turned on the same two days. They sold a net 265,628 shares on 29 July, three weeks after buying a net 354,419 shares on 7 July — itself a +7.91% session. (Source: Korea Exchange investor-type data via our own daily collection; share counts, not values.)
- 23 March −15.55% — the second largest single session — and this one does sit in a disclosure gap. The audit report was filed 13 March and the annual report 20 March; nothing was filed on or just before 23 March. Whatever moved the shares 15.55% that day is not in the filings.
- 3–4 March, consecutively −7.23% and −9.04% — −15.61% combined (₩387,500 on 27 February to ₩327,000 on 4 March; the two daily moves compound rather than add).
- 23, 26 and 29 June: −8.40%, −5.27%, then +9.84% — a complete round trip inside five sessions.
- Thirteen of the twenty-one fall in June and July alone — 8, 11, 17, 23, 26 and 29 June, then 1, 7, 9, 23, 27, 28 and 29 July.
Notably, HYBE’s 52-week high was set on 13 February 2026 — ₩405,500 intraday, with the closing high of ₩404,500 coming on 19 February. (Prices: settled Korea Exchange daily data.)
That puts the high one day after 12 February 2026 — and naming only one event on that date would smuggle in a cause. DART received four HYBE filings that day, besides the adverse first-instance ADOR ruling: the FY2025 provisional results (20260212801161); the “15% or more change in revenue or profit structure” disclosure printing operating profit −72.9% on revenue +17.5% — this article’s title, in HYBE’s own words (20260212801167); a cash-dividend decision (20260212801151); and the treasury-share acquisition of 546,120 donated shares (20260212001232). Five events, one day, and the 52-week high the next. We draw no inference: these are five facts, not a mechanism.
And one caveat on the method itself: a 5% price screen misses the heaviest foreign selling days in our flow window — both of them. Neither of the two biggest foreign net-sell sessions we hold appears in the list above.
The largest by share count is 22 September 2026, when foreign investors net sold HYBE (352820) −152,130 shares, worth −$17.6M. The shares fell only 3.82% that day, because retail bought a net 227,858 shares into it.
The largest by dollar value is a different day — 2 July 2026, when foreign investors net sold HYBE (352820) −113,384 shares, worth −$17.9M. HYBE rose 4.66% that session.
Note that the two swap places depending on the unit you pick, which is why we name the unit rather than crowning one day. Price screens find price events; they do not find flow events. Both need checking, which is why this section has two halves. (Flows from our own daily collection of Korea Exchange investor-type data, 18 June to 23 September 2026; dollar values are net shares × that session’s settled close, translated at the single rate stated at the top of this article.)
🏛️ Who Controls HYBE, and Has It Ever Cancelled a Share?
Bang Si-hyuk owns 30.86% personally — 31.75% including related parties — and has been the largest shareholder continuously since 2005. HYBE has never retired a single common share since it listed. The filing says it in one line: “the Company’s largest shareholder Bang Si-hyuk and related parties own 13,529,672 common shares (31.75%).”
| Holder (at 31 Dec 2025) | Shares | Stake |
|---|---|---|
| Bang Si-hyuk (founder, inside director) | 13,151,394 | 30.86% |
| Netmarble Corp. (games) | 3,930,813 | 9.23% |
| National Pension Service | 3,678,212 | 8.63% |
| Dunamu Inc. (operator of Upbit) | 2,302,570 | 5.40% |
| Treasury shares (held by HYBE itself) | 113,337 | 0.27% |
| All other shareholders | 19,432,870 | 45.61% |
| Total | 42,609,196 | 100.00% |
Basis: consolidated financial-statement note 1(1), “주요 주주현황” (principal shareholders), at 31 December 2025 — the one HYBE table on this subject whose rows add up to the 42,609,196 shares outstanding. Percentages are ours, computed to two decimals from the share counts; the filing prints one decimal. Rows are re-ordered by size (the filing lists Dunamu above the National Pension Service). Separately, on its own basis, the annual report discloses 183,627 small shareholders holding 47.53%. And the footnote names its holder: against the Netmarble row the filing states “during the period, exchangeable bonds were issued with 528,576 of the shares held as the exchange property” — the pledged block is Netmarble’s, not an unnamed holder’s. Source: DART FY2025 annual report, rcpNo 20260320000802.
Why not the more obvious tables? The annual report also carries a “5% or more shareholders” table and a “small shareholders” table, and English write-ups often splice them. They cannot be added — they are overlapping populations. Our own sum of the spliced rows comes to 43,321,212 shares, or 101.68% of the company: an excess of 712,016 shares that a table with no total row hides completely.
Two governance features of this company are unusual enough to be worth an investor’s attention, and neither is widely reported in English. Both sit in filings a non-Korean reader is unlikely to open — including HYBE’s annual Corporate Governance Report, a mandatory comply-or-explain disclosure filed 29 May 2026 (rcpNo 20260529801390) that exists in Korean only.
First: the share count goes up, never down. The FY2025 annual report’s share-total table is explicit. Cumulative common shares reduced since listing — by capital reduction, by profit cancellation, or by redemption — is zero in all three categories. The table does show 2,402,149 shares “reduced,” but books every one under “other — conversion into common shares”: redeemable convertible preferreds that converted, not stock retired. The capital-reduction, profit-cancellation and redemption rows are all dashes. Meanwhile:
| Shares outstanding | Count | Change |
|---|---|---|
| 31 Dec 2023 | 41,652,097 | — |
| 31 Dec 2024 | 41,652,097 | unchanged |
| 31 Dec 2025 | 42,609,196 | +957,099 (+2.30%) |
| 23 Sep 2026 | 43,106,836 | +497,640 (+1.17%) |
| Cumulative dilution | — | +3.49% |
Counts at fiscal year-ends are the figures printed in the filing, not derived: the FY2025 annual report prints 41,652,097 twelve times and 41,652,098 not once. (Dividing the reported paid-in capital of ₩20,826,049 thousand by the ₩500 par value gives 41,652,098 — a one-share artefact of the capital figure being rounded to the nearest thousand won, and the reason a derived count should never overrule a printed one.) The 23 September 2026 count is listed shares per the Korea Exchange. The FY2025 increase corresponds to a ₩214,379,446 thousand ($158.8M) rise in share premium, consistent with conversions of convertible and exchangeable bonds — DART records exercise notices on 17 Oct 2025, 5 Nov 2025 and 28 Jan 2026.
This is a striking contrast with the direction of Korean corporate governance right now. Under the Value-Up programme, large Korean companies have been buying back and cancelling stock at scale — KB Financial retired roughly 7% of itself, and Shinhan has run successive cancellation tranches. HYBE filed a Value-Up plan of its own on 23 April 2026. Its contents: a three-year shareholder-return policy for FY2025–FY2027, funded by 30% of consolidated free cash flow, with a minimum dividend of ₩500 per share guaranteed, delivered through “dividends and treasury-share purchases.” The word cancellation does not appear. (Source: DART Value-Up plan disclosure, rcpNo 20260423800633, 23 Apr 2026.)
Second: HYBE’s treasury stock is largely a gift from its founder, and it flows straight through to employees. This is the detail that most rewards reading the Korean filings, because the English-language summary “HYBE announces share acquisition” is actively misleading.
On 19 May 2026 HYBE filed a treasury-share acquisition decision for 192,126 common shares. The acquisition method is recorded as “무상수증” — receipt as a gift, free of charge — and the expected acquisition amount is blank, because there is none. The filing states that the largest shareholder decided to donate 192,126 of his own HYBE shares to the company at no cost, on condition that they be used as a performance-compensation resource for employees of HYBE and its affiliates. A materially identical acquisition was filed on 12 February 2026. (Source: DART rcpNo 20260519000290.)
The shares then leave again. On 25 August 2026 HYBE filed a treasury-share disposal decision for 24,420 shares at ₩174,600 — ₩4,263,732,000, about $3.2M — with a disposal purpose of “compensation for employees of the company and its affiliates,” a counterparty of “employees of the company and affiliates,” and a disposal window of 1 September to 25 November 2026. The filing’s closing note ties it explicitly back to the February and May donations. (Source: DART rcpNo 20260825000350.)
The disposal filing also discloses the split of HYBE’s treasury holdings, and this is the number that settles the question. Immediately before that disposal, HYBE held 93,837 shares (0.22%) acquired within distributable profits — that is, bought with company cash — and 619,137 shares (1.44%) acquired by other means, the donation route. The 0.22% bucket was identical in the 19 May filing three months earlier. Over that window, HYBE bought back none of its own stock with its own money; all of the movement was the founder’s gifts arriving and employee grants leaving.
Why this matters to a minority holder. A buyback-and-cancellation raises your claim on every future won of earnings. A founder donation routed to employee compensation does not: it transfers value from the founder’s personal stake to employees, with the company as a conduit, and leaves your per-share claim untouched. It is arguably generous to the founder’s credit — he is funding staff pay out of his own holding rather than the company’s cash. It is simply not a shareholder return, and describing it as a “share acquisition programme” invites precisely the wrong inference. Separately, HYBE paid a ₩500 dividend totalling $15.9M for FY2025 out of a net loss.
On the payout ratio, note a genuine basis conflict between two HYBE filings a few weeks apart. The FY2025 annual report’s dividend table reports a consolidated cash payout ratio of −9.05% — negative, because the denominator is the ₩237,280 million ($175.7M) loss attributable to owners. The April 2026 Value-Up filing reports a prior-year payout ratio of 25.0%, computed on the high-dividend-company (고배당기업) definition in Article 104-27 of Korea’s Restriction of Special Taxation Act — a tax designation granted on payout ratio and dividend growth, which certifies the payout and says nothing about its durability. Both are correctly reported; they measure different things. If you see “HYBE payout ratio 25%” quoted without a basis, that is the tax-statute figure, not the accounting one.
Finally, the label structure carries obligations that do not appear in the debt line. HYBE has granted put options to minority shareholders across its subsidiaries, letting those holders require HYBE to buy them out. The filing’s wording differs case by case and the differences matter: all or part of the 5% minority in Pledis and the 25% in KOZ; part of the 20% in ADOR (the matching call covers the full 20%, so “a put over 20% of ADOR” overstates it); the whole 20% in Source Music and the whole 3.59% in HYBE Latin America. Weverse is a different instrument: on NAVER’s investment HYBE discloses a right of first refusal plus a right for the counterparty to require HYBE to buy — not the symmetric put-and-call the subsidiaries carry. Minority interests on the balance sheet are $218.0M, 8.3% of total equity, and they absorbed a $12.7M share of the FY2025 loss.
The ADOR put is in active litigation, and the filing is precise about it where press coverage is not. HYBE terminated the shareholders’ agreement with ADOR’s entire minority shareholder group and sued for confirmation that the termination was valid. On 12 February 2026 the court of first instance dismissed HYBE’s claim and, on the minority shareholders’ counterclaim for the share purchase price, ordered HYBE to pay. HYBE appealed, applied to suspend enforcement pending the appeal, and on 25 February 2026 deposited ₩29,250 million — about $21.7M — with the court. The filing states that whether the options are exercisable at all will be determined by the final outcome of the appeal. (Source: DART FY2025 annual report, derivatives and put-back-option note, rcpNo 20260320000802.) We report only what that filing says; we make no claim about how the appeal will be decided.
⚠️ The Bear Case — including against this article’s own framing
- Our own “mix shift” explanation may be too kind. We argue the margin collapse is a mix effect — albums out, concerts in. But album units fell 50.9% in two years, faster than the market’s 31.4%. If that is demand loss rather than format rotation, then the “mix shift” is a polite name for the core product shrinking, and the low-margin replacement revenue is not a strategy but a consequence.
- The balance sheet is 55.9% intangible and the impairment cycle may not be over. Ithaca Holdings and QC Media still carry $761.3M of goodwill on assumed revenue growth of 26–28% a year. Those assumptions were written down once in FY2025. HYBE’s own sensitivity disclosure shows the charge moves with small changes in terminal growth and discount rates.
- The adjusted figure is the company’s, not an auditor’s. We give HYBE’s ₩229.4bn adjusted H1 operating profit prominence because it is disclosed, reconcilable and non-cash — but it is a management non-IFRS measure, its Q2 inputs are explicitly unreviewed, and share-based pay is a real cost to shareholders even when the founder funds it. Taking only the adjusted number is the mirror-image mistake of taking only the reported one.
- Accounting quality: the tax line is unpredictable and punitive. Effective rates of 117.7% (FY2024), not-computable (FY2025) and an expected 246.28% (FY2026) mean reported net income is close to uninformative. $124.0M of deferred tax assets went unrecognised — the company’s own judgment that those losses will not be recovered.
- Governance: dilution up, cancellation zero. Shares outstanding rose 3.49% since end-2023 with no offsetting retirement, a dividend was paid out of a loss, and the Value-Up plan promises “treasury-share purchases” without committing to cancel anything. The distinction is not cosmetic: cancellation permanently shrinks the share count, whereas a buyback only parks shares — and HYBE’s parked shares are on a path back out to employees.
- Contingent buy-out obligations sit outside the debt line. Put options over minority stakes in five subsidiaries, one of them (ADOR, 20%) already the subject of an adverse first-instance judgment with a $21.7M court deposit lodged. The size of the total obligation is not disclosed as a single figure.
- Artist concentration is structural and unquantified. HYBE does not disclose revenue by artist or by label. A reader cannot tell from the filings how much of the $1.96bn depends on any one group — and the exclusive-contract schedule names the members but not the contract terms or expiry dates.
- Against our own sector framing, in the other direction. We show that “sector selloff” fails over 20 and 60 sessions, where SM rose 22.7% and YG 8.7% while HYBE fell. But all five peers are down 37.9–57.5% year to date, and the whole album market shrank 31.4%. Both framings are window-dependent, and we cannot tell you which window will matter next.
- The technology strategy has now been abandoned twice over. Supertone was written down 75.8% and then resolved for dissolution within six months, after HYBE had invested in it since 2021. The Tech segment still lost $60.2M in FY2025. Removing the loss-maker helps reported profit; it also removes the growth story that justified the segment.
- There is no US-traded alternative, and that is a real friction. No depositary receipt appears in SEC registration records, the US exchange symbol master, or commercial databases carrying comparable Korean unsponsored ADRs (see the ticker section above for the full evidence and its one stated limitation), so a US or EU investor must access the Korean market directly — and the “HYBE” ticker on their broker is an unrelated sub-penny shell, while the Nasdaq name most often confused with HYBE has itself just been renamed from KWM to NXAT (OTC Markets and Nasdaq symbol directory, 28 Sep 2026).
📚 Lingo Check
| Term | What it means |
|---|---|
| Multi-label strategy 멀티 레이블 |
Running several creatively independent record labels under one holding company, each with its own roster and management. HYBE says it operates 15. For an investor it means separate minority shareholders, separate goodwill and separate results inside one ticker. |
| Cash-generating unit (CGU) 현금창출단위 |
The smallest group of assets tested together for impairment. Goodwill is allocated to CGUs, and each is tested annually against its projected cash flows — which is why HYBE must publish growth and margin assumptions for each subsidiary. |
| Unrecognised deferred tax 미인식 이연법인세 |
Tax relief on accumulated losses that a company declines to record as an asset, because it does not expect enough future profit in that entity or jurisdiction to use it. Recognising the change as an expense is what can push an effective tax rate above 100%. |
| Treasury share disposal 자기주식 처분 |
Selling or transferring shares the company already holds back out — to employees, a partner, or the market. The opposite of cancellation: the shares return to circulation and the share count is unchanged. |
| Employee share compensation buyback 임직원 주식보상 자기주식 취득 |
A treasury purchase whose disclosed purpose is staff remuneration, carrying a disposal deadline rather than a cancellation commitment. ⛔ It does not permanently reduce the share count — the opposite of a buy-and-cancel, though English headlines call both “buyback.” Both of HYBE’s 2026 treasury acquisitions are of this kind. |
| Acquisition by donation 무상수증 |
A company receiving its own shares as a free gift, typically from a controlling shareholder. It appears in Korean filings as a treasury-share acquisition with a blank purchase price, and it is not a buyback. |
| Put-back option on a minority stake 풋백옵션 |
A right granted to a subsidiary’s minority shareholders to force the parent to buy their stake, usually on defined conditions. A contingent cash obligation that does not appear as debt. |
| Value-Up plan (a company filing under the Value-Up Program) 기업가치 제고 계획 |
The Value-Up Program is Korea’s 2024+ reform push urging listed firms to lift shareholder returns; a Value-Up plan is the individual voluntary disclosure in which one company states its policy and targets. Voluntary in both filing and content — a plan can promise buybacks without promising cancellation. |
🎯 Why It Matters for K-Export Stars
HYBE is the cleanest available demonstration of why we read Korean filings instead of Korean headlines. Everything that made the FY2025 result what it was is disclosed — and almost none of it is reported in English. The revenue-mix table that explains the margin collapse is in the annual report. So is the segment note showing a division that loses more than it sells. The assumption that an AI subsidiary will grow 62.5% a year at a negative 34.7% margin is in the goodwill footnote. The 246.28% expected tax rate is printed in the half-year report. And the ₩255.0bn charge that turned the first half into a loss is named, quantified and adjusted out by the company itself — in a one-page fair disclosure that exists in Korean only.
None of that requires a source, a model, or a view — only reading the primary document in the language it was written in. That is the whole of our edge, and this company is where it shows most clearly, because the English-language narrative about HYBE is about artists while the Korean-language filing is about accounting.
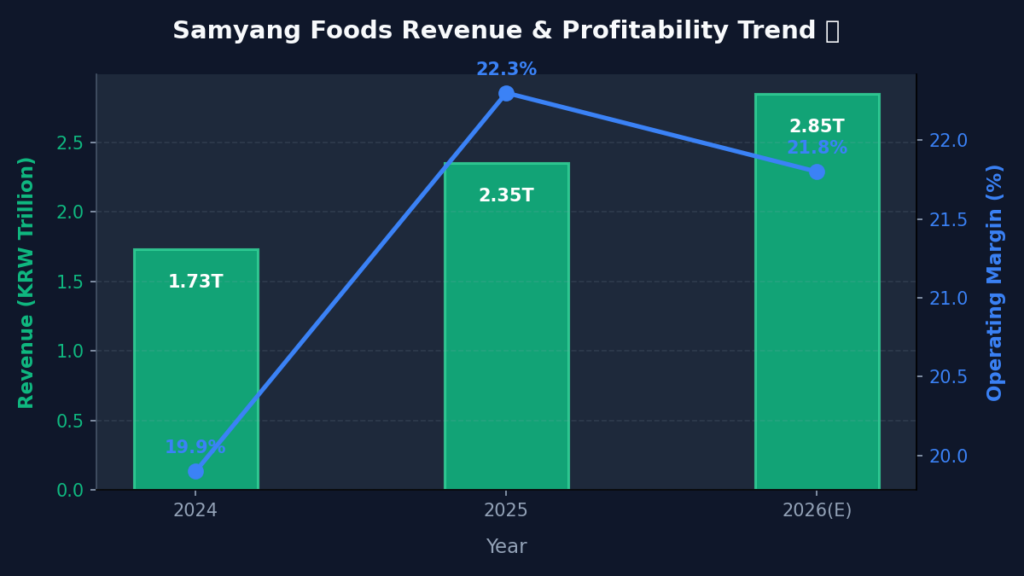
It also connects to the site’s central theme. The Korea Discount is usually explained by governance, and here the governance question is unusually concrete: a company that has never cancelled a share, in a market where its largest peers are cancelling billions of dollars of stock, filing a Value-Up plan that carefully does not promise to. Whether that gap closes is a governance question, not a music question. For contrast within the Culture cluster, compare the very different economics of Samyang Foods, whose margins expanded as it globalised, and our guide to K-beauty stocks, where the same export tailwind runs through a manufacturing rather than an IP model.
Conclusion
HYBE’s FY2025 numbers look like a company in trouble and read like a company in transition — and the filings let you tell the difference. Revenue grew 17.5%, then 78.1% again in the first half of 2026 — a half that reads as a $19.0M operating loss, or a $169.9M operating profit on HYBE’s own adjusted basis, with ₩255.0bn of non-cash founder-funded share compensation between the two. But the album business that once supplied 44.56% of revenue has shrunk 20.4% in dollars and halved in units, and the concerts and merchandise that replaced it carry far thinner margins. That single substitution took the operating margin from 13.6% to 1.9%.
Below the operating line, two things made a bad year look worse: $198.9M of impairments — 5.45× operating profit, led by a 75.8% write-down of the AI-voice unit HYBE’s own model expects to run at a negative margin — and a tax line that turned an H1 2026 pre-tax profit into a net loss at a disclosed 246.28% effective rate. Neither is an operating problem; both are consequences of the structure: fifteen labels across six countries, $1.24bn of goodwill, $218.0M of minority interests, and put options letting minority holders in five subsidiaries force a buy-out.
The valuation is neither obviously cheap nor expensive here, because there are no clean earnings to value it against. What is unambiguous is the shareholder-return record: zero shares cancelled, ever; a 3.49% increase in the share count since end-2023; a dividend paid out of a loss; and a treasury programme funded by the founder’s gifts and paid out to employees. In a market where the Value-Up programme has made cancellation the benchmark, that is the number to watch next — and the filings will show it before the headlines do.
Disclosure of interest. The author’s household portfolio holds no HYBE (352820) shares, and no shares in SM Entertainment, JYP Entertainment, YG Entertainment, Studio Dragon or Dear U. It does hold 12 units of the KODEX 200 ETF, which tracks the KOSPI 200 index; HYBE is a KOSPI 200 constituent (verified against a Korea Exchange constituent list dated 18 September 2026), so that is indirect exposure. Among other companies named in this article, the portfolio holds Hana Financial Group; it holds no shares in KB Financial Group, Shinhan Financial Group, NAVER, Netmarble or Dunamu.
Disclaimer: This article is for informational and educational purposes only and is not investment advice, a recommendation, or an offer to buy or sell any security. All figures are drawn from official filings and market data as of the dates stated; prices, valuations and financial data change and may be out of date by the time you read this. Currency conversions use a single stated rate and are for comparison only. Statements about litigation and regulatory matters reflect only what the cited filings say as of their filing dates and are not predictions of outcomes. Do your own research and consider consulting a licensed financial adviser before making any investment decision. See our corrections policy.