Foreigners sold $6.02bn of Korean shares in five sessions this week. The KOSPI finished the week down 0.23%. Those two facts sit side by side because a single category — the one Korean data calls “other corporations” — bought $5.92bn, and bought almost exactly the same amount on the day the index fell 3.26% as on the day it rose 2.66%. This is also the first issue of this column computed after Korea started producing two closing prices per stock. We audited our own pipeline before writing a word of it, found one field already carrying the wrong one, and are telling you which close is behind every number below.
🔑 Key Takeaways
- Foreigners net sold $6,016.6M over the five sessions and the KOSPI moved −0.23%. Individuals also sold, by $530.6M. Institutions bought $624.5M. The entire offset came from other corporations at +$5,922.8M — 98.4% of the foreign selling, absorbed by one category.
- 99.1% of that corporate buying was in two stocks, and the category switched on the day their buyback windows opened. SK hynix took ₩5,537.8bn of the week’s ₩8,048.1bn and Samsung ₩2,437.0bn; the third-largest name took ₩41.0bn. Across the 41 sessions from 22 June to 19 August the market-wide residual never left −₩167.0bn to +₩235.0bn. On 20 August, day one of SK hynix’s filed window, it printed +₩1,071.3bn. It has run near ₩1.6tn a session since — through a day that fell 3.26% and a day that rose 2.66%.
- SK hynix was net sold in both windows and rose in both windows. Foreign net selling of −$2,532.3M over five sessions and −$7,593.7M over twenty, against price changes of +2.48% and +7.34%. This series requires both windows to agree before it calls anything a trend. Here they agree, and they disagree with the tape.
- Every price in this issue is a KRX settled close, and that now matters. Since 14 September a Korean stock has two end-of-day prices. On the week’s own arithmetic, 150 stocks — 6.0% of the 2,519 we can test, including two of the 86 largest — change the direction of their weekly move depending on which close you use. Hanwha Aerospace: −0.28% settled, +1.02% by feed.
- We promised to score four open tests in this issue. All four failed. Not one of the four residual anomalies from Issue #9 was explained by any disclosure inside its five-business-day window. We are not rewriting the test a fourth time. We are retiring the claim that our residual can be verified against filings — while keeping the residual itself.
This is Foreign Flow Watch, our weekly read of where global capital actually moved in Korean equities. Every figure below is computed from settled exchange data for the 2,547 KOSPI and KOSDAQ common stocks in our published universe that carried a settled Korea Exchange price on 18 September 2026. Week of 14–18 September 2026, five trading sessions. Previous issue: Issue #9, week of 11 September. The full series lives at the Foreign Flow Watch hub.
📈 Both boards went nowhere. The path did not.
| Index | 11 Sep close | 18 Sep close | 5-session change |
|---|---|---|---|
| KOSPI | 6,909.91 | 6,894.23 | −0.23% |
| KOSDAQ | 820.64 | 827.12 | +0.79% |
Source: Korea Exchange settled index data, KRX Open API, queried 19 September 2026. Measured on this series’ standard weekly window — previous Friday’s close to this Friday’s close — the convention fixed in Issue #7 so the return matches the five sessions of flow data printed beside it.
| Session | KOSPI | KOSPI % | KOSDAQ | KOSDAQ % |
|---|---|---|---|---|
| Mon 14 Sep | 6,684.37 | −3.26% | 806.79 | −1.69% |
| Tue 15 Sep | 6,627.26 | −0.85% | 812.41 | +0.70% |
| Wed 16 Sep | 6,717.97 | +1.37% | 815.98 | +0.44% |
| Thu 17 Sep | 6,715.41 | −0.04% | 822.18 | +0.76% |
| Fri 18 Sep | 6,894.23 | +2.66% | 827.12 | +0.60% |
Source: Korea Exchange settled index data (KRX Open API), queried 19 September 2026.
Quick take. A −0.23% weekly print is one of the least informative numbers the KOSPI produced this year. Monday alone took 3.26% off the index; Friday put 2.66% back. The intra-week low, 6,627.26 on Tuesday, was 4.09% below where the week started and 27.3% below the 2026 high of 9,114.55 set on 22 June. Anyone who saw only the weekly close saw a quiet week. There was no quiet week.
💸 Foreigners sold $6.0bn. One category bought almost all of it.
| Investor category | 5 sessions (14–18 Sep) | 20 sessions (24 Aug–18 Sep) |
|---|---|---|
| Foreign | −$6,016.6M | −$14,930.7M |
| Institutions | +$624.5M | +$2,215.3M |
| Individuals (retail) | −$530.6M | −$10,028.5M |
| Other corporations (기타법인) | +$5,922.8M | +$22,744.0M |
| Total, four categories | +$0.1M | +$0.1M |
Net buy (+) / net sell (−) in shares, valued session by session at that day’s settled close and converted at that day’s Bank of Korea market average rate. Universe: the 2,547 KOSPI and KOSDAQ common stocks in our published universe with a settled price on 18 September 2026; preference shares and ETFs are excluded. The “other corporations” line is the residual recovered by requiring the four categories to sum to zero each session. Source: our own settled flow data, KRX settled closes and the Bank of Korea market average rate series.
The daily breakdown is where the week stops being a flat line.
| Session | KOSPI % | Foreign | Institutions | Individuals | Other corporations |
|---|---|---|---|---|---|
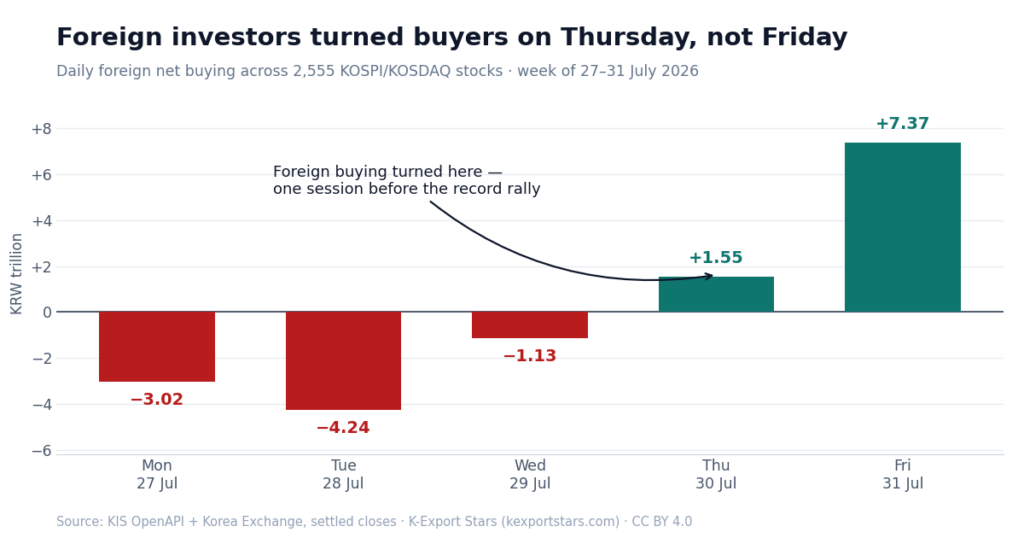
| Mon 14 Sep | −3.26% | −$2,356.7M | −$901.0M | +$2,155.1M | +$1,102.6M |
| Tue 15 Sep | −0.85% | −$1,088.6M | −$658.3M | +$536.4M | +$1,210.5M |
| Wed 16 Sep | +1.37% | −$1,236.3M | +$914.5M | −$911.3M | +$1,233.0M |
| Thu 17 Sep | −0.04% | −$1,755.3M | +$180.0M | +$407.0M | +$1,168.3M |
| Fri 18 Sep | +2.66% | +$420.2M | +$1,089.3M | −$2,717.9M | +$1,208.4M |
Same method and universe as the table above: net shares by session, valued at that session’s settled close, converted at that session’s Bank of Korea market average rate (₩1,346.4 · ₩1,345.3 · ₩1,353.3 · ₩1,368.3 · ₩1,380.3 per dollar).
Foreigners sold on four of five sessions and bought on the fifth, which happened to be the week’s largest gain. Individuals did the reverse: they bought $2,155.1M into Monday’s 3.26% fall and sold $2,717.9M into Friday’s 2.66% rise. Those two lines are close to mirror images, and either one on its own would support a tidy story about who is right. We do not know who is right, and neither does anyone else yet.
⚠️ We are describing simultaneity, not cause. Nothing in this data shows that foreign selling moved prices or that retail buying stopped them. Monday is the counter-example we would use against ourselves: foreigners sold $2,356.7M and the index fell 3.26%, which fits. Thursday they sold $1,755.3M — three-quarters as much — and the index moved −0.04%. Wednesday they sold $1,236.3M and the index rose 1.37%. Across five sessions the relationship between the size of foreign selling and the size of the index move is not one you could trade.
🧱 Why Was the Corporate Bid the Same Size Every Day?
Because it is not a view on the market — it is two disclosed buyback programmes executing against a filed won budget and a daily order cap, which is a mechanical process and looks like one.
Read the last column of the daily table again. In won, the “other corporations” net buy ran ₩1,484.5bn, ₩1,628.5bn, ₩1,668.6bn, ₩1,598.5bn and ₩1,667.9bn. The largest day is 12.4% above the smallest, and the smallest day was Monday — the 3.26% crash, the session on which an opportunistic buyer with ₩1.6tn a day to deploy would have leaned in hardest. It did not. It bought slightly less than average and then bought the same amount every day afterwards. On its own that is suggestive and no more — five sessions is a short window, and two paragraphs below we widen it and show what breaks.
Korea lets you check that inference against a document rather than guess at it. Both of the country’s largest buyback programmes were filed in August, with the won amount, the window and the daily order-quantity cap printed in the filing: SK hynix’s ₩40,004,340,000,000 programme running 20 August to 19 November 2026 (rcpNo 20260819000254), and Samsung Electronics’ ₩14,999,999,992,000 programme running 24 August to 21 November 2026 (rcpNo 20260821000616). Tracking the residual in each name since its start date gives this:
| Programme | Sessions so far | Residual buying | % of filed won amount | Issue #9 estimate | This week’s estimate |
|---|---|---|---|---|---|
| SK hynix ₩40.00tn ($28.98bn) | 22 | ₩24.06tn | 60.14% | 36.7 sessions | 36.6 sessions |
| Samsung Electronics ₩15.00tn ($10.87bn) | 20 | ₩10.16tn | 67.71% | 29.1 sessions | 29.5 sessions |
Completion is computed on the won amounts, because the filings state the won as the commitment and describe the share count as derived from a reference close that may change. Residual = the “other corporations” category in that single stock, session by session since the programme start date, valued at each session’s settled close. Dollar equivalents use ₩1,380.3/$ as of 18 September 2026. Both filed windows run about 63 sessions. This is an upper bound on issuer buying, not a measurement of it — the category contains every corporate share dealing in the name, not only the buyback.
Two facts make that attribution much harder to argue with than the flatness alone. First, concentration: of the week’s ₩8,048.1bn of market-wide residual buying, SK hynix accounts for ₩5,537.8bn and Samsung Electronics for ₩2,437.0bn — ₩7,974.8bn, or 99.1%, in two stocks. The third-largest, Hyundai Steel at ₩41.0bn, is one-hundred-and-thirty-fifth of SK hynix. Whatever this category is doing, it is doing it in the two companies that filed buyback programmes and almost nowhere else.
Second, and more decisively, the category switched on. Across the forty-one sessions from 22 June to 19 August 2026 the market-wide residual never once left the band −₩167.0bn to +₩235.0bn. On 20 August — the first day of SK hynix’s filed window — it printed +₩1,071.3bn. On 24 August, the first day of Samsung’s, +₩1,600.6bn, and it has stayed near that level since. A six-fold step change landing on two filed start dates is a stronger piece of evidence than any amount of day-to-day steadiness, and it is the test we should have led with.
Why this series starts on 22 June and not earlier. The residual is a four-category identity, so it cannot be computed for a session in which one of the four categories is missing. In our own data the individual-investor field is absent for every stock on 18 and 19 June 2026, and the sessions before that cover 25 stocks rather than the full universe. 22 June 2026 is the first session on which all four categories exist for the whole universe, so it is the first session this measurement is defined. We are stating that rather than quietly starting the chart wherever it flattered the argument — and we checked: all 63 sessions from 22 June to 18 September carry a complete four-category record for 2,547 to 2,555 stocks, with no gaps.
⚠️ The steadiness is real but window-dependent, and we would rather say so. Five sessions is a short window to call anything flat. Widen it to the twenty sessions this issue also reports and the same series runs from −₩57.4bn to +₩1,785.2bn, because of a single day: 3 September 2026, when the residual went negative market-wide. SK hynix and Samsung were normal that day (+₩1,025.0bn and +₩495.5bn); they were swamped by corporate selling in POSCO International (−₩947.2bn), Woori Financial (−₩485.2bn) and POSCO DX (−₩191.4bn). One ordinary block of corporate share dealing outweighed both buyback programmes combined. That is the category doing what its name says, and it is why the number above is an upper bound rather than a measurement.
The run-rate estimate barely moved in a week: 36.7 → 36.6 sessions for SK hynix and 29.1 → 29.5 for Samsung, against filed windows of roughly 63. That leaves about 15 and about 10 more sessions of buying. With the Chuseok closure on 24–25 September and public holidays on 5 and 9 October, both land in the first half of October 2026 — six weeks inside the filed windows. That has been this column’s standing claim since Issue #8, and a second week of data did not move it.
🔁 Did Foreigners Sell SK hynix and Samsung This Week?
Yes — and they sold both stocks over twenty sessions as well, which is the stronger statement, because a single window invents narratives and two windows that agree do not.
| Company | 5-session foreign | 5-session price | 20-session foreign | 20-session price |
|---|---|---|---|---|
| SK hynix (000660) | −$2,532.3M | +2.48% | −$7,593.7M | +7.34% |
| Samsung Electronics (005930) | −$1,916.3M | +0.58% | −$5,233.3M | −7.28% |
| Two stocks, total | −$4,448.6M | — | −$12,827.0M | — |
Foreign net buy (+) / net sell (−) in shares, valued session by session at that day’s settled close and that day’s Bank of Korea market average rate. 5-session window = 14–18 September 2026; 20-session window = 24 August – 18 September 2026. Price changes run from the close before each window to 18 September — 11 September for the 5-session column, 21 August for the 20-session column — so each price change spans exactly the sessions its flow column covers. Share counts are not summed across the two companies because the share prices differ by a factor of seven; only the dollar column is additive.
The two companies are 48.5% of our universe’s market value and carried 73.9% of all foreign net selling over five sessions and 85.9% over twenty. Foreign selling in Korea this month has been, to a first approximation, foreign selling of two memory stocks.
SK hynix is the sharper case. Over the five sessions 14–18 September 2026, foreigners net sold $2,532.3M of SK hynix. SK hynix rose 2.48% over that window. Over the twenty sessions 24 August – 18 September 2026, foreigners net sold $7,593.7M of SK hynix. SK hynix rose 7.34% over that window. Flow and price disagree on both, in the same direction, in the second-largest company in the country.
Samsung is the contrast. Its price and its flow point the same way over twenty sessions — net selling against a 7.28% fall — and opposite ways over five, where a 0.58% gain sits on top of $1,916.3M of net selling. Same sector, same week, two different relationships between flow and price, which is why this column prints both windows and refuses to pick one. The two stocks closed the week at $1,345 (₩1,857,000) and $189 (₩261,000) respectively, both as of 18 September 2026.
One detail worth keeping: Friday reversed inside SK hynix. Foreigners bought 723,470 shares on 18 September after selling on each of the four preceding sessions (−1,215,512, −586,836, −262,655, −701,796). The weekly net of −2,043,329 shares is arithmetically correct and hides a turn on its final day. For context on how these four categories are constructed and where they mislead, see our reference piece on how foreign and institutional flows move Korean stocks.
🕓 Does Korea’s New Evening Session Change These Numbers?
Not the flow figures — we verified them against the exchange’s own investor-trend records and they match to the share — but it did change one price field inside our own database, and we found it by looking before we wrote this issue rather than after.
On 14 September 2026 the Korea Exchange opened a continuous after-market running 16:00–20:00 KST. Yesterday we published a measurement of what that did to end-of-day data: in a 60-stock sample, a widely used market-data library’s close matched the KRX settled close on 239 of 239 stock-days before launch and differed on 221 of 240 after, with the daily percentage change carrying the opposite sign on 14% of stock-days. Publishing that and then computing a flow column off the wrong close the next morning would have been the least defensible thing this column could do. So we ran three checks first.
| Question | What we tested | Answer |
|---|---|---|
| Do our flow figures now include evening trades? | Compared our per-session foreign and institutional net-buy share counts against the Korea Exchange’s own investor-trend records for six stocks over six sessions, including all four post-launch sessions. | No — and they match exactly. 36 of 36 stock-days agree to the individual share, foreign and institutional, so our series and the exchange’s are the same series. Which session that series covers is settled by the exchange’s own daily record, in the table below: for five stocks the evening print lies outside the high and low the exchange published for 18 September, so the exchange’s high–low excludes evening trades. The accumulated volume sits in that same row, and the investor-trend gross buy total equals it to the share. Regular-session-only high–low, regular-session-only volume, and an investor-trend series that reconciles to that volume. Week-on-week comparisons in this column are still measured with the same ruler. |
| Which close do our prices come from? | Compared every close in our price table for 18 September against a direct pull of the KRX Open API settled closes. | Settled, all of them. 2,762 of 2,762 stocks match exactly, on the newest session and on every session back to 11 September. |
| Is any field already wrong? | Our flow table carries its own close column, sourced from a broker API rather than the exchange. We checked it against the settled close. |
Yes, for the newest session only. On 18 September it differs from the settled close for 2,016 of the 2,437 universe stocks that traded that day (82.7%; 2,016 of all 2,547 including non-traders), and matches the vendor evening price on 59 of 60 in a spot check. For 11–17 September it matches the settled close. The broker feed restates the previous session overnight; the most recent one carries the unofficial evening price. No figure in this issue uses that column. |
All three checks run on 19 September 2026 against KRX Open API settled data and, for the first row, the Korea Exchange investor-trend series. Each was run with a positive control first — a case we already knew should fire — because a check that silently tests nothing returns a clean zero and looks like good news.
| Stock, 18 Sep 2026 | Settled close | Published high | Published low | Feed close |
|---|---|---|---|---|
| Precision Bio (335810) | ₩1,477 | ₩1,655 | ₩1,471 | ₩1,696 |
| Wonlim (005820) | ₩14,560 | ₩14,570 | ₩14,360 | ₩16,000 |
| Daehan Synthetic Fiber (003830) | ₩112,500 | ₩114,000 | ₩111,200 | ₩122,000 |
| CU Medical (115480) | ₩2,330 | ₩2,370 | ₩2,265 | ₩2,100 |
| Hancom Lifecare (372910) | ₩2,110 | ₩2,200 | ₩2,050 | ₩2,270 |
Five stocks whose 18 September evening price lies outside the high–low range the exchange published for the same date. The evening trades unquestionably happened; the exchange’s own high and low do not contain them. That is the direct evidence that the daily record — and the accumulated volume in the same row, which the investor-trend series reconciles to exactly — covers the regular session only. Source: KRX Open API daily prices versus the broker-sourced close in our flow table, both queried 19 September 2026.
The third row of the audit table is the uncomfortable one, and it is ours. A field we own carried the unofficial price for four days and nothing in its name said so. That is precisely the failure we described in another organisation’s data yesterday. We found it because we assumed we had it too.
The consequence for a reader is not abstract. Because a weekly change is a ratio of two closes, using the evening price at one end changes the answer — and sometimes changes its sign:
| Stock | Market cap | Week, settled closes | Week, feed closes |
|---|---|---|---|
| Hanwha Aerospace (012450) | $40.3bn | −0.28% | +1.02% |
| HMM (011200) | $14.2bn | −0.24% | +0.48% |
| Hyosung (004800) | $1.9bn | −0.25% | +0.19% |
| Korean Re (003690) | $1.9bn | −0.40% | +0.47% |
| Hyundai Department Store (069960) | $1.5bn | −0.81% | +0.10% |
| Kolon Industries (120110) | $1.2bn | −1.05% | +0.35% |
Every stock above $1bn of market value in our universe whose weekly direction changes sign between the two close conventions. Weekly window 11 → 18 September 2026. “Settled closes” are the KRX Open API closing prices; “feed closes” are the broker-sourced closes in our flow table, which match the vendor evening price on 18 September. Market cap converted at ₩1,380.3/$ as of 18 September 2026. The testable set is 2,519: the 2,547 universe stocks carrying both a settled and a feed close on 11 and 18 September, less 28 screened out for a weekly move beyond ±40% on either convention (rights issues, splits and similar). Across it the count is 150 (6.0%); above $1bn it is 6 of 266 (2.3%); above $5bn, 2 of 86. The numerator is 150 under every denominator we tried — 150 of 2,547 before the corporate-action screen, 150 of 2,346 if stocks with a zero change on either convention are also dropped.
Hanwha Aerospace is the case that should worry a screen-builder: a $40.3bn defence name, one of the twelve export champions this column tracks, whose week reads as a small loss on the exchange’s numbers and a small gain on a feed’s. The settled close on 18 September was ₩1,078,000, which was also the session’s regular-hours low; the feed carries ₩1,092,000. Neither number is fabricated. Only one of them is the closing price. If you want the mechanics of the session that produces the second one, we wrote them up when the rules were published: what actually changed on 14 September, and the broader market-structure background in our Nextrade explainer.
📊 The export-champion scoreboard: 5 sessions against 20
| Company | 5d foreign | 20d foreign | 5d price | 20d price | Windows agree? |
|---|---|---|---|---|---|
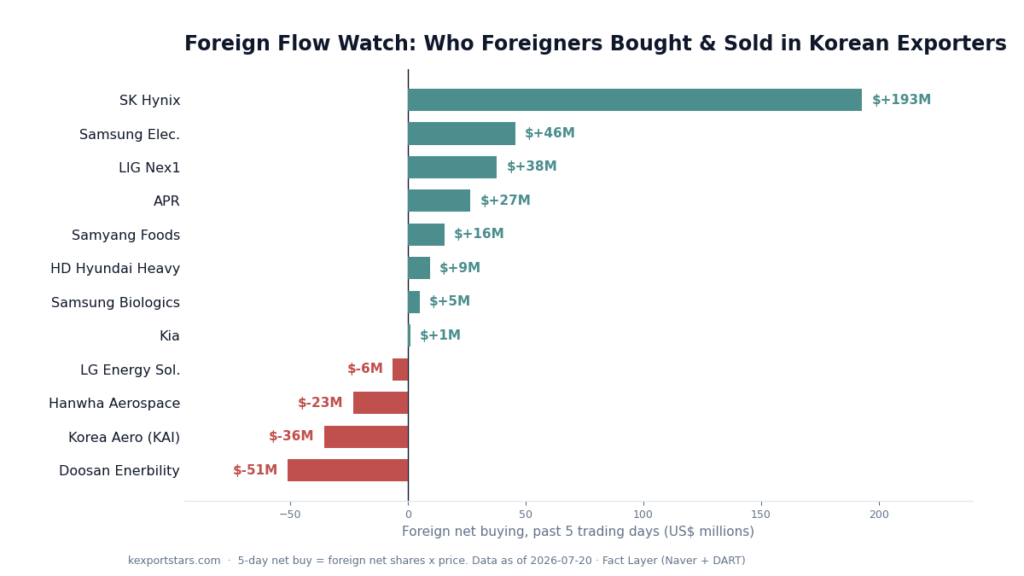
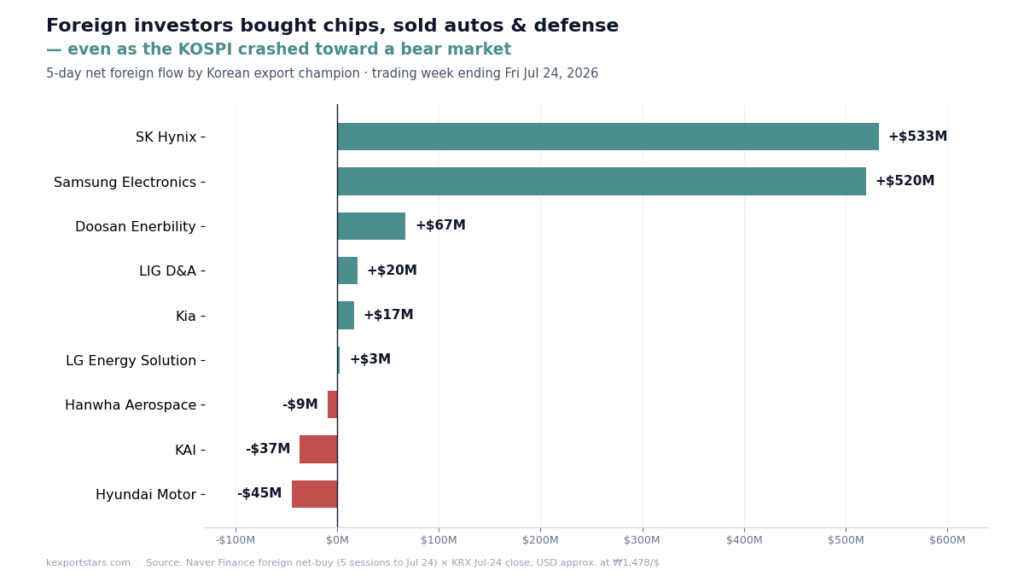
| SK hynix | −$2,532.3M | −$7,593.7M | +2.48% | +7.34% | Yes |
| Samsung Electronics | −$1,916.3M | −$5,233.3M | +0.58% | −7.28% | Yes |
| Doosan Enerbility | −$144.5M | −$282.9M | −6.50% | +15.83% | Yes |
| HD Hyundai Heavy | −$19.0M | −$80.1M | −3.97% | +1.55% | Yes |
| Hanwha Aerospace | −$20.1M | −$37.5M | −0.28% | −0.65% | Yes |
| LG Energy Solution | −$6.4M | −$28.5M | +1.11% | +5.97% | Yes |
| LIG Defense & Aerospace | +$28.3M | +$67.8M | +9.73% | +7.05% | Yes |
| KAI | +$1.4M | −$7.2M | −0.54% | −0.15% | No |
| Kia | −$14.1M | +$6.2M | −3.71% | −6.88% | No |
| Samsung Biologics | −$0.4M | +$44.4M | −1.20% | −9.86% | No |
| Samyang Foods | −$4.1M | +$23.7M | +1.72% | −4.83% | No |
| APR | −$3.8M | +$26.8M | −1.34% | −4.68% | No |
5-session window = 14–18 September 2026. 20-session window = 24 August – 18 September 2026. Foreign net buy (+) / net sell (−), valued session by session at that day’s settled close and that day’s Bank of Korea market average rate. Price changes run from the close before each window (11 September and 21 August respectively) to 18 September, on KRX settled closes. “Windows agree” asks only whether the two flow columns share a sign.
Five of twelve disagree between the windows. A reader shown only the five-session column would say foreigners were selling Kia, Samsung Biologics, Samyang Foods and APR this week; the twenty-session column says they have been net buyers of all four over the month. A reader shown only the twenty-session column would say they were selling KAI; the week says they bought it. Neither reader is wrong about the number in front of them. Both would be wrong to call it positioning. Two names survive both windows and have the price agreeing with the flow. LIG Defense & Aerospace was bought in both and rose 9.73% on the week. Hanwha Aerospace was sold in both (−$20.1M and −$37.5M) and fell in both (−0.28% and −0.65%) — but its weekly move is the one that flips sign on a feed close, as the previous section showed, so the agreement in that row is worth exactly as much as the close convention behind it. LIG Defense & Aerospace’s 9.73% survives any convention; Hanwha’s 0.28% does not.
☢️ The nuclear basket, one week on
Issue #9’s lead finding was that all four companies in Korea’s nuclear export chain were net sold by foreigners in both windows while every one of them rose, one by 41%. We set a falsifier: if the basket’s foreign flow turns net positive over both windows within four weeks while the prices hold, then “sold in both windows” was an artefact of one fortnight’s tape. Week one of four:
| Company | 5d foreign | 20d foreign | 5d price | 20d price |
|---|---|---|---|---|
| Doosan Enerbility (034020) | −$144.5M | −$282.9M | −6.50% | +15.83% |
| KEPCO E&C (052690) | −$31.9M | −$113.2M | −11.97% | +46.23% |
| BHI (083650) | −$8.9M | −$47.0M | −5.99% | +13.81% |
| KEPCO KPS (051600) | −$5.2M | −$8.0M | −5.58% | +6.28% |
| Basket total | −$190.5M | −$451.2M | — | — |
Same windows, method and rate convention as the tables above. Price changes from the close before each window to 18 September 2026 on KRX settled closes. Basket total sums the dollar column only.
The flow half of the test is unchanged: all four net sold in both windows, and the five-session selling more than doubled, from −$78.9M to −$190.5M. The price half broke in the other direction — every one of the four fell this week, KEPCO E&C by 11.97%. So the juxtaposition that made Issue #9’s headline (“rose, and foreigners sold all of it”) no longer describes the current week, while the flow claim it rested on got stronger. Both halves are in the table. Over twenty sessions the four are still up between 6.28% and 46.23%, which is what a one-week fall of this size looks like inside a rally. Three weeks of the falsifier remain.
🏛️ Three Samsung independent directors bought — and the dates in the filing are not the trade dates
Foreigners sold $1,916.3M of Samsung Electronics this week. In the same window, three of the company’s own independent directors filed reports showing on-market purchases. The amounts are trivial. The fact that you can see them at all, with prices attached, three days later, is not.
| Director | Role | Holding after | Stated price | Date in filing | Settled range that day |
|---|---|---|---|---|---|
| Shin Je-yoon | Board chair, independent director | 210 shares | ₩268,000 | 14 Sep 2026 | ₩248,500–₩254,500 — impossible |
| Lee Hyuk-jae | Independent director | 348 shares | ₩273,500 | 11 Sep 2026 | ₩256,500–₩261,500 — impossible |
| Cho Hye-kyung | Independent director | 600 shares | ₩259,250 | 15 Sep 2026 | ₩246,000–₩252,000 — impossible |
| Cho Hye-kyung | Independent director | 800 shares | ₩250,250 | 16 Sep 2026 | ₩247,500–₩254,000 — consistent either way |
Filings: rcpNo 20260917000097 (Shin), rcpNo 20260918000191 (Lee), rcpNo 20260918000212 (Cho). “Holding after” and “Stated price” are the 변동후 소유주식수 and 취득/처분단가 printed line by line in each filing — Cho’s two lines run 500 → 600 → 800 shares. Settled ranges are the KRX regular-session high and low for Samsung Electronics on the date the filing prints. Share count 6,648,649,811 is the 발행주식총수 these three filings print. Samsung’s largest-shareholder report of the same week (rcpNo 20260918800754) breaks that total into 5,846,278,608 common and 802,371,203 preference shares, so the denominator above is not the listed common line. Each holding rounds to 0.00% either way.
Three of the four line items name a price the stock did not trade at on the date beside it. That is not an error in the filing — it is the form working as designed, and the form says so in its own footnote: “where shares are traded on the securities market, the date is the settlement date” (증권시장에서 주식등을 매매한 경우에는 그 계약결제일). Korean equities settle on T+2. Shift each date back two sessions and every price lands inside that day’s range: Shin’s ₩268,000 sits in 10 September’s ₩263,500–₩270,500; Lee’s ₩273,500 in 9 September’s ₩267,500–₩275,000; Cho’s ₩259,250 in 11 September’s ₩256,500–₩261,500. Her second line, ₩250,250 against 16 September, is consistent with both readings, so we leave it ambiguous rather than round it into the story.
Quick take. Two of these purchases were executed on 9 and 10 September — before the crash week they appear to sit inside. A screen that reads the filing date as the trade date would report three directors buying the dip. What actually happened is that two of them bought near the prior week’s highs and one bought on 11 September. Directionally the conclusion survives; the dates do not. Combined, the three hold 1,358 shares of a 6.65-billion-share company, which is a governance signal and nothing whatsoever about supply and demand.
🇯🇵 SK hynix answered the exchange on Friday, and the answer was “undetermined”
SK hynix filed exactly one disclosure between 12 and 19 September 2026: an inquiry-disclosure response, undetermined, on 18 September (rcpNo 20260918800583). It re-answers a Korea Exchange demand issued at 11:35 on 21 August 2026 about a press report headlined “SK hynix to build a semiconductor plant in Japan.” The word re-answers matters: the filing’s own related-disclosures field records that the company replied the same afternoon, at 16:03 on 21 August, with an “undetermined” answer. Friday’s document is the three-month re-disclosure that answer obliged it to make. The full text, translated: “To strengthen the competitiveness of our memory business we are reviewing various options including the establishment of additional production bases, but nothing has been determined to date. We will re-disclose at the point at which specifics are determined, or within three months.” The filing names a re-disclosure date of 17 December 2026 and is signed by CFO Kim Woo-hyun.
Friday was also the session on which SK hynix rose 6.42% and foreigners turned net buyers of it for the first time that week. Both of those are figures from settled exchange data; neither appears in the filing, and we are not connecting them to it. The filing is the same answer the company gave four weeks earlier, on a schedule set in August — there is no new information in it to connect anything to.
What the filing does is convert a rumour into a calendar entry. There are now two of them: the company used the same form on 9 September to say nothing about reported plans for its Chongqing packaging stake (rcpNo 20260909800559), itself a re-disclosure of an August answer, with the next date set at 8 December. Two dated appointments, 8 and 17 December, on questions a company elsewhere could simply decline to answer. For a foreign investor the useful output is not the answer; it is the date.
🧾 Scorecard: how Issue #9 held up
Issue #9 left five testable conditions. Two resolved this week and neither resolved our way; three remain open on schedule. We use failed below in two different senses and flag which is which: the residual test failed against us — we made a claim and the evidence did not support it — while the 620,000-share test failed as a test, meaning the signal it was watching reversed, which says nothing about whether we were right.
| Condition from Issue #9 | Outcome |
|---|---|
| Third restatement of the third-name test, with a size floor: a residual above 1% of shares outstanding in a company worth more than $1bn, with no large-holding report, treasury-share filing or largest-shareholder change inside five business days. Four names qualified. “All four get scored in Issue #10.” | Four of four failed. The five-business-day window closed on 18 September. We pulled every DART filing for all four companies across the window, paginated in full. DL E&C (+1.59% of shares): one filing, a 17 September serious-accident report at a subsidiary — none of the three qualifying types. Hyundai Department Store (+1.28%): one filing, a 15 September IR notice — none of the three types. SK IET (−1.09%): zero filings. Lotte Shopping: five filings, three of the qualifying types — and all three report the same event, Shin Dong-bin’s holding falling 17,007,667 → 16,686,337 shares, 60.12% → 58.99% — a change of −1.13 percentage points, the only percentage these filings print (rcpNo 20260915000364). Wrong party: the filer is an individual director, our residual sits in the corporate category. Wrong direction: the filing is a disposal, our residual is a purchase. Not one of the four was explained. The percentages above are our own flow figures and appear in none of these filings. |
| “If the nuclear basket’s foreign flow turns net positive over both windows within four weeks while the prices hold…” | Not triggered; one half broke anyway. Foreign flow stayed negative in both windows and more than doubled over five sessions (−$78.9M → −$190.5M). But the prices did not hold: all four fell, KEPCO E&C by 11.97%. The flow claim survived; the headline framing did not. Three weeks left. |
| “If SK hynix’s daily residual band stays below 620,000 shares for two more weeks, the run-rate projection of 36.7 sessions is stale.” | Failed in week one — but the week set both records, and printing only one would be cheating. The band: 575,319 · 656,354 · 653,652 · 663,136 · 616,769. Three of five sessions cleared 620,000 and Thursday’s 663,136 is the highest day of the programme, so the test does not hold. But Monday’s 575,319 is also the programme’s lowest day, below the 600,643 floor that prompted the test in Issue #9. The band widened in both directions in the same week rather than drifting down. The projection moved 36.7 → 36.6 sessions, which is no change, and the honest reading is that a five-session band is too noisy to carry this test at all. |
| “If either execution report, when filed, shows materially less than ₩18.52tn (SK hynix) or ₩7.72tn (Samsung) bought through 11 September…” | Open. DART checked for every filing by both companies, 12–19 September 2026. Samsung filed five documents, SK hynix one; none is a treasury-share execution report, and neither is due yet. This remains the authoritative check and the one we cannot run. |
| “If the Lee Jae-yong purchase settles on 12 October and any visible trace of it appears in the four-category flow data…” | Open, on schedule. The pre-announced off-exchange purchase — 7,188,793 shares at ₩269,500 from Hong Ra-hee — settles on 12 October 2026 (rcpNo 20260909000516). Samsung’s 18 September largest-shareholder report (rcpNo 20260918800754) shows the control group at 1,151,607,863 shares, 17.32%, down 9,936 shares from 8 September — and no trace of that transfer, exactly as an unsettled off-exchange purchase should look. |
What we are doing about the test that failed four times out of four. Issue #9 said of it, in its own words, that it was “still badly written — this is the second consecutive rewrite” and that it “fires every week by construction and tells us almost nothing.” We then rewrote it a third time, with a size floor, and it produced four clean candidates. All four failed. When a test has been rewritten three times and returns the same verdict on the fourth pass, the defect is not the wording. It is the design: we were asking a disclosure regime to confirm a number it was never built to confirm.
Korea’s filing rules are triggered by who holds what — crossing 5%, a 1% change by an existing large holder, a largest-shareholder change, a treasury-share decision. Our residual measures who traded on the exchange this session, in a category that lumps every corporate share dealing together. Those two things overlap sometimes and coincide exactly almost never. Issue #9’s own POSCO example made the point without our noticing: a filing did appear, and it was roughly twice the size of our residual.
⚠️ So we are retiring the claim, not the measure. From this issue, this column no longer asserts that its residual can be verified against DART filings, and will not run a fourth version of that test. The residual stays, and so does everything we use it for — the buyback run-rate above is built on it and is falsifiable by a different route, the execution reports both companies must eventually file. What changes is the wording: the residual is an upper bound on corporate buying that we cannot attribute to a named party. Every previous issue that implied otherwise was over-claiming, and this is the correction.
Our running record of grading ourselves: Issue #4 scored Issue #3 at two failures of three; Issue #5 scored Issue #4 at three holds and one open; Issue #6 scored Issue #5 at two failures of three; Issue #7 scored Issue #6 at three tests that could not run; Issue #8 recorded one of its own tests as badly written; Issue #9 recorded the same test failing after a rewrite. This week it failed four times out of four and we withdrew it. We print the bad weeks at the same size as the good ones, and this is a bad week.
🧩 Prove this issue wrong
- If the “other corporations” daily bid keeps running near ₩1.6tn after both buyback windows are exhausted — on our estimate, from roughly the middle of October — then attributing that steadiness to the two programmes is wrong, and the category is measuring something much larger that we have mislabelled. This is the cleanest falsifier this column has, because it has a date and requires no filing.
- If either execution report shows materially less than ₩24.06tn (SK hynix) or ₩10.16tn (Samsung) bought through 18 September, our residual-based completion percentages of 60.14% and 67.71% are upper bounds we leaned on too hard. Still the authoritative check; still not yet available.
- If the nuclear basket’s foreign flow turns net positive over both windows in the next three weeks, Issue #9’s central finding was a two-week artefact. Week one did the opposite: the selling doubled.
- If the broker feed’s close column in our own database still carries the evening price for sessions older than one day when we check again next Saturday, then our description of it as a one-session restatement lag is wrong and the contamination is deeper than four days. We will re-run the same three checks and print the result either way.
- If the pre-announced Lee Jae-yong transfer of Samsung Electronics shares settles on 12 October and produces any visible trace in the four-category flow data, then our claim that off-exchange transfers are invisible to this dataset is wrong, and the residual is measuring something broader than we think. Checkable on 12 and 13 October.
Our weakest number this week is the 20-session dollar column, for the same reason as last week and in the opposite direction. The won weakened 3.15% across the five sessions alone, from ₩1,338.2 on 11 September to ₩1,380.3 on 18 September, reversing part of the 5.4% strengthening Issue #9 measured across its 20-session window, 14 August to 11 September. Across the full 20-session window the rate ran from ₩1,383.6 to ₩1,380.3 — nearly flat end to end, but with a ₩1,337.9 low in between. A 20-session dollar figure computed at a single end-date rate therefore differs from one computed session by session by around 2% for a stock whose flow holds one sign, and by more where the sign flips inside the window. Every dollar figure in this issue uses session rates and every table says so. Share counts and won figures are exact.
📚 Lingo Check
| Term | What it means |
|---|---|
| Settled close 종가 (확정) |
The official closing price of a Korean stock, struck in the 15:30 KST closing auction and published by the Korea Exchange. Since 14 September 2026 a second, unofficial last-traded price also exists, formed when the 16:00–20:00 after-market ends. The exchange’s own daily percentage change and the ±30% daily price band both measure from the settled close; nothing in a data feed’s field name distinguishes the two. |
| After-hours continuous trading 시간외접속매매 |
The 16:00–20:00 KST session the Korea Exchange launched on 14 September 2026, replacing the old 16:00–18:00 batch auction. It matches orders continuously, like the regular market. Its prints do not enter the exchange’s daily OHLCV record or its investor-trend series. |
| Other corporations 기타법인 |
The investor category covering non-financial corporate entities trading on the exchange — including an issuer buying its own shares. It is the residual in a four-category split, so any single figure in it is an upper bound on issuer buying, not a measurement of it. |
| Officers’ and major shareholders’ ownership report 임원ㆍ주요주주 특정증권등 소유상황보고서 |
The filing a Korean director or 10% holder must make after their holding changes, printing the quantity, the resulting stake and the trade price. Its date column is the settlement date (계약결제일), not the trade date — with T+2 settlement, subtract two sessions before matching a price to a chart. |
| Largest-shareholder holdings change report 최대주주등소유주식변동신고서 |
A periodic filing listing every share movement inside the controlling shareholder group, line by line with dates and causes. It is how you confirm whether an announced transfer has actually settled. |
| Inquiry-disclosure demand 조회공시 요구 |
The Korea Exchange can compel a listed company to respond to press reporting or market rumour. If the answer is “undetermined,” the company must name a date by which it will re-disclose — normally within three months. For a foreign investor this converts a rumour into an appointment. |
| Treasury-share acquisition decision 주요사항보고서(자기주식취득결정) |
The statutory DART filing a Korean issuer must make before buying its own shares. It names the won amount, the start and end dates, the purpose, the broker and a daily order cap — which is why a Korean buyback is knowable in advance rather than inferred afterwards. |
| Market average rate 매매기준율 |
The reference USD/KRW rate published each business morning by the Seoul money-brokerage system and carried in the Bank of Korea’s ECOS database, derived from the previous business day’s interbank trades. It is the rate Korean filings themselves use to fix contract values, which is why this series uses it for every dollar conversion. |
| Standard weekly window | This series’ convention since Issue #7: the weekly index and price change is measured from the previous week’s last trading session close to the current week’s last trading session close, so it spans exactly the five sessions of flow data printed beside it. |
🎯 Why it matters for K-Export Stars
A single KOSPI print told you Korea was flat this week. Underneath it, foreigners removed $6.02bn, retail sold another $530.6M, and a single corporate category put back $5.92bn at a pace that did not vary by more than 12% from the worst day to the best. Two memory stocks were 73.9% of the foreign selling over five sessions and 85.9% over twenty, and one of them rose in both windows while being sold in both. Meanwhile three of Samsung’s independent directors bought 1,358 shares between them on dates that are not the dates printed in their filings, and SK hynix told the exchange it has nothing to confirm about a Japanese fab until 17 December.
None of that requires a view on memory pricing. It requires reading the filings, matching them to settled exchange data, and printing the disagreements instead of the tidy version — including the disagreement we found inside our own database this week. The reason this column can do that is structural: Korea makes issuers disclose a buyback’s won budget and window before they buy, makes insiders report what they bought and at what price, and makes companies answer the exchange on the record when a rumour moves a stock. Western coverage rarely reads those documents because they are published in Korean. For how the flow categories themselves are built, start with how foreign and institutional flows move Korean stocks; for the two stocks at the centre of this issue in dollar terms, Samsung and SK hynix stock prices in USD; for the reactor chain, our nuclear export chain map and Doosan Enerbility valuation; and for what the evening session actually changed, Korea’s two closing prices.
Conclusion
The most useful number this week is the one that switched on a month ago and has not switched off. Korea’s corporate investor category sat inside a ±₩235bn band for the whole of the summer, then jumped to ₩1.07tn on the day SK hynix’s filed buyback window opened and to ₩1.6tn when Samsung’s did — with 99.1% of this week’s version landing in those two stocks. That is not a market view, it is a budget being spent, and it went on spending at the same rate through a 3.26% crash and a 2.66% rally. On our estimate that budget has about fifteen sessions left in SK hynix and about ten in Samsung, which puts both in the first half of October rather than the filed November deadlines. What the market looks like when the largest and least price-sensitive buyer in it stops is the question this column will be asking from mid-October, and we would rather set it up now than discover it afterwards.
The second item is a correction to ourselves. We spent three issues claiming our residual could be checked against Korean disclosure filings, rewrote the test twice, added a size floor, and then watched all four candidates fail. The residual is still useful and still falsifiable — by execution reports, and by whether the daily bid survives October. The claim that DART confirms it was never sound, and we are withdrawing it rather than writing a fourth version.
Every figure here is reproducible from our open dataset — the same KOSPI and KOSDAQ common stocks used throughout this issue, updated every trading day, CC BY 4.0, DOI 10.5281/zenodo.21833374 — computed with the same daily-sum method the dataset uses: each session’s net shares multiplied by that session’s settled close, then summed. Index levels and closing prices are settled data from the Korea Exchange, re-verified against the KRX Open API on 19 September 2026. USD/KRW is the Bank of Korea market average rate, session by session, taken from ECOS statistic table 731Y001, item code 0000001 (원/미국달러, 매매기준율), daily frequency — so every conversion here is reproducible from that table. Filing terms are quoted from the DART documents linked above. This issue makes no causal claim about flows; where flow and price disagree, we print the disagreement. Corrections are logged under our corrections policy.
Disclosure of interest. The author holds positions in Samsung Electronics (005930) and SK hynix (000660), two of the stocks this issue discusses, and in other Korean equities not named above. The author holds no position in any of the four nuclear-chain companies or in Hanwha Aerospace, HMM, Hyosung, Korean Re, Hyundai Department Store or Kolon Industries. No position was opened or closed in any stock named above in connection with this article.
Disclaimer: This article is for informational and educational purposes only and is not investment advice, a recommendation, or an offer to buy or sell any security. Figures are as of 18 September 2026 and go stale quickly; prices, flows and programme-completion estimates in particular. Do your own research and consult a licensed adviser before investing.
This issue originally referred to 079550 as “LIG Nex1”, the company’s former name. It was renamed LIG Defense & Aerospace, approved at the 31 March 2026 AGM and effective on the exchange from 14 April 2026; the ticker is unchanged. Source: DART company filing. No figure in this issue changes — the correction is to the name only.